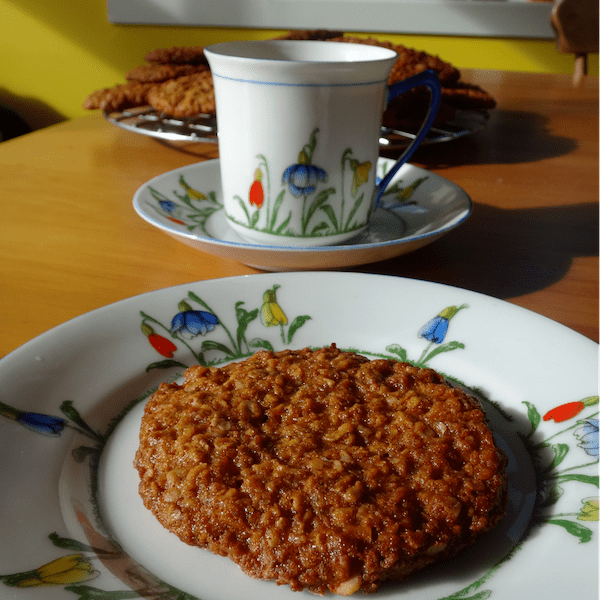
Every year, in the lead up to Anzac day (25th April) when Australians and New Zealanders remember all those who died at war, we bake and eat sweet biscuits associated with WWI.
After 100 years I wanted to calculate the impact of my biscuits on global warming. Each ingredient needs to be harvested, prepared and packaged before transporting to my local shop. What is the carbon footprint of these activities? Because food is grown in different parts of the world, I wanted a New Zealand figure. I found a thesis by M.J. Drew from the University of Otago called “Healthy & Climate-friendly eating patterns for New Zealand” and it had all the information I wanted (Drew et al. 2020).
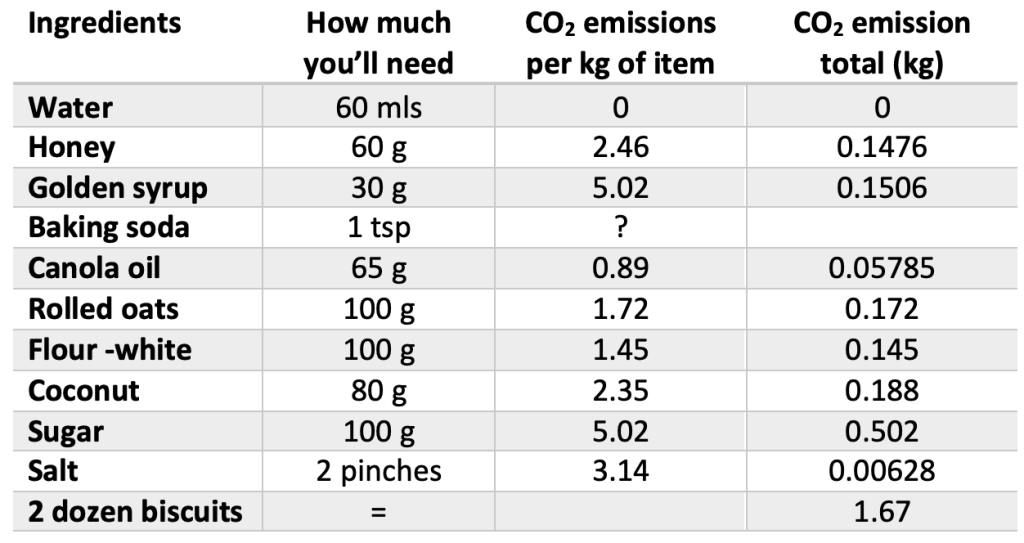
NZCPE ANZAC recipe
The Anzac biscuit has been described as a culinary icon embedded in the Australian and New Zealand intangible cultural heritage (Cobley 2016) – but it is also a sweet and crunchy treat. The name “ANZAC” first appeared in recipe books during the First World War and what is now known as the Anzac biscuit seems to have emerged independently in kitchens in New Zealand and Australia ~1918 using the same basic ingredients that were readily available at the time (Leach 2008).
Method: Heat water in bowl in microwave on high (about 40sec at 800-1000 watts), add baking soda, honey, golden syrup, oil and stir. Add oats, flour, coconut, sugar and two good pinches of salt. Mix thoroughly. Dust baking try with flour. Place teaspoonfuls of mixture onto the tray. Bake 180oC for about 10 mins until biscuits have melted flat and are golden brown. Allow to cool slightly before removing from tray onto a rack. Eat with a hot cup of tea.
For each food item, farming and processing produces most of the greenhouse gasses (with a few exceptions; Figure 1). Other stages in what is called the “lifecycle” of the food such as packaging, transport, refrigeration all contribute a smaller proportion of emissions per item, but it adds up.
FIgure 1
For some ingredients and many recipes there are a range of possibilities; one could use butter or margarine, apples or oranges. If I use canola oil in my biscuits instead of butter, I make the biggest difference to the total footprint. Most canola oil on my supermarket shelf is from rapeseed plants that were not grown in New Zealand, but there are a few yellow fields of rapeseed (Brassica napus) grown, harvested and pressed for oil in this country (e.g. Pure oil NZ). Even though transport is a much bigger contributor to the total for the canola oil I used (about 50%; Figure 1), growing a plant (rapeseed) produces much less CO2 than dairy farming. Butter also needs refrigerating. But without butter I need to add a pinch of salt to my biscuits. Per kg salt has a fairly high emission level and I wonder if we could reduce how far salt needs to travel? – selecting locally produced brands would help (I didn’t need to use pink salt from the Himalayas to get the taste I wanted and I made sure to reduce my chance of suffering from goitre by using a salt with iodine added).
I was surprised to discover that honey production has a lower footprint than either salt or sugar or golden syrup – although more CO2 is invested in packaging honey, the transport and production releases less CO2 in total. But honey is expensive, and it doesn’t easily convert into the same volume of sugar in a recipe. Here I have reduced the golden syrup and sugar a bit, and added honey, but traditional Anzac biscuit recipes (from 1920’s) all have golden syrup. In fact, I might be breaching the NZ law if I don’t have enough golden syrup, as the law here requires that the name ‘Anzac’ is only associated with the original basic recipe (and that they are never referred to as cookies). In addition, completely replacing sugar and golden syrup with honey risks ‘food waste’ by producing a softer biscuit that doesn’t get eaten, so I’ve tried to balance emission-reduction with taste.
Electricity in New Zealand can be completely renewable and so I brought my electricity for baking my biscuits from ecotricity.
In general, vegetables, fruits and whole grains are less climate-polluting (1.2−1.8 kgCO2e/kg) than animal-based foods (12−21 kgCO2e/kg). Potentially I could reduce my CO2 emissions by up to 42%, depending how much I reduce meat and dairy from my diet and continue to minimise food waste – I might even live longer!
Cobley, J. 2016. Should we safeguard ‘the idea of the Anzac biscuit recipe’? Women’s Studies Journal, 30 (1): 62-70. ISSN 1173-6615
Drew, J. Cleghorn, C. Macmillan, A. Mizdrak, A. 2020. Healthy and climate-friendly eating patterns in the New Zealand context. Environmental Health Perspective 128(1) https://doi.org/10.1289/EHP5996.
Leach, H. 2008. The pavlova story: A slice of New Zealand’s culinary history. Dunedin, New Zealand: Otago University Press.
Every year in April, the trees start changing colour, the clocks go back an hour, and the national greenhouse gas figures are released and promptly forgotten.
They take fifteen months to prepare, so by the time they come out it’s very easy for commentators to point out that they are out of date. Even now that the national media are running several new climate change stories every day, this one seems to pass us by. Not only are the figures out of date, they are also highly technical and hard to interpret: the year-to-year changes might be influenced by one-off factors like the weather, while the long-term trends have been subject to the changing winds of climate policy.
The Ministry for the Environment does an amazingly thorough job of reporting greenhouse gas emissions. The latest release includes a 633 page report accompanied by 100 MB of data – 300 spreadsheets in all. But as for interpreting the data, they don’t go very far:
Between 2018 and 2019, gross emissions increased by 2 per cent, which was largely attributed to an increase in emissions from the energy sector (by 5 per cent ot 1,711 kt CO2-e) drive mainly by an increase in emissions from manufacturing industries and construction, largely due to an increase in methanol production, and an increase in emissions from public electricity and heat production, primarily driven by an increase in natural gas-fired and coal-fired electricity generation in response to lower levels of hydro generation.
The “energy sector” is exactly the part we’re supposed to be focusing on. A 5% increase in one year, unless it’s some sort of one-off exception, is disastrous. We need to be cutting those energy emissions by at least 5% a year. The Ministry makes is sound like those increases just happened. But how can that be, when we’re in an emergency and climate politics is front and centre? What’s the relationship between emissions and climate policies?
CO2 emissions reach record highs
To try and get a grip on recent trends, I’m going to look at the changes from 2016 to 2019. Gross CO2 emissions did at first fall over the past decade, from 41.2 Mt in 2008 to 38.3 Mt in 2016, before rising again to 42.2 Mt in 2019. This turnaround is a worry and could indicate that climate policy over the period has failed. The three years 2017 to 2019 saw a massively increased focus on climate change: September 2017 saw Labour returned after a decade in a strikingly climate-led election. A Zero Carbon Bill (originating with the youth climate movement Generation Zero) was promised and extensively debated over 2018 and 2019, becoming law in November 2019.
Meanwhile, Greta Thunberg burst onto the world stage in late 2018, leading to massive School Strikes 4 Climate throughout New Zealand and the world in 2019. Climate emergencies were declared throughout the country, and eventually by Parliament itself.
Surely anyone even tangentially involved with fossil fuels would have realised that change was coming?
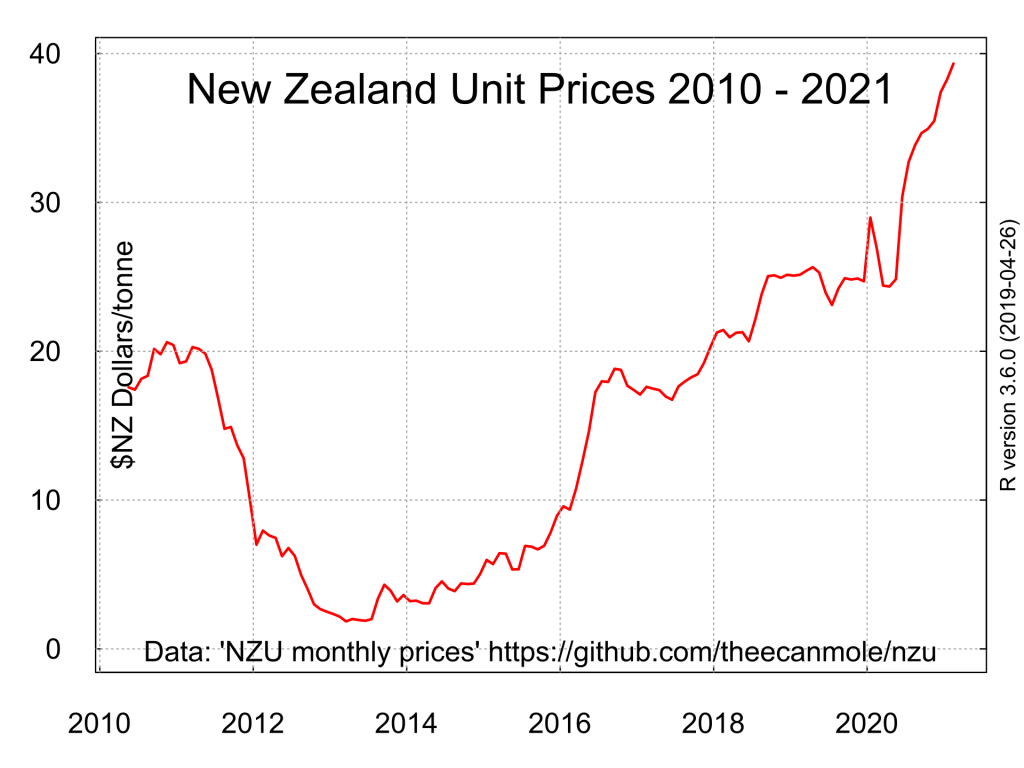
In fact, change had already been signalled before the 2017 election. The 2008 Emissions Trading Scheme, which had been weakened almost as soon as it was introduced, began to return to its original plan, with a 50% discount being removed during 2017 and 2018. Carbon prices rose, perhaps indicating that emitters expected to face more restrictions:
Carbon price (per tonne of CO2) in the New Zealand Emissions Trading Scheme. Until 2019 only half a unit was needed for each tonne of emissions, effectively halving the price.
Although on the surface it looks like carbon prices tripled during 2017-2019, it is difficult or impossible to know how much emitters actually paid. Several years worth of credits have been banked ahead of time, many bought when prices were much lower, and many imported from Russia and Ukraine in dodgy deals: as the “low integrity” of these carbon credits became known, New Zealand companies were left as the only buyers, leading to very, very low prices (and an end to international carbon trading). In addition, many large emitters get 60% or 90% discounts, to protect them from international competition. The only large sectors that are fully exposed to the ETS are domestic transport and electricity.
Emissions up 10% in three years
CO2 emissions (kilotonnes)
2016
2019
Change
Fully in ETS?
Road transport
13462
14560
+1098
+8%
Yes
International aviation
3274
3856
+582
+18%
Electricity
3029
4171
+1142
+38%
Yes
Food processing (dairy)
2689
3237
+548
+20%
Metal industry (70% steel, 30% aluminium)
2251
2236
-15
-1%
Chemicals (mostly methanol)
1999
1875
-123
-6%
Agricultural industry, forestry, and fishing
1370
1430
+60
+4%
Fugitive fossil fuel emissions
1239
1021
-218
-18%
Yes
Agriculture (50% lime, 50% urea)
1089
1117
28
+3%
Mining & other industry
1022
1194
+172
+17%
Commercial buildings
995
1130
+135
+14%
Yes
International shipping
943
1009
+66
+7%
Domestic aviation
919
1015
+97
+11%
Yes
Oil refining
847
882
+34
+4%
Yes
Non-metallic minerals: energy (cement, lime, glass)
727
618
-109
-15%
Residential buildings
585
628
+44
+8%
Yes
Non-metallic minerals: industrial processes
466
596
+130
+28%
Pulp, paper, and print
381
421
+40
+10%
Manufacture of solid fuel
291
354
+63
+22%
Yes
Domestic shipping
270
329
+59
+22%
Yes
Chemical industry (hydrogen, ammonia)
191
183
-8
-4%
Iron and steel industries
176
190
+14
+8%
Rail transport
129
126
-3
-2%
Yes
Total CO2
38343
42180
+3836
+10%
New Zealand’s CO2 emissions (kilotonnes) in 2016 and 2019, compared.
Let’s look at the big four.
Road transport (up 1098 kt CO2) is in the ETS, but a carbon price is a terrible way to reduce emissions in this sector. Even $50/tonne only adds 10 cents per litre to the price of fuel, which itself is only weakly linked to people’s transport decisions. The main causes of the rise in emissions are the almost exclusively car-focussed transport system, which has left us with the highest rate of car ownership in the OECD, and a lack of fuel efficiency standards. These had been on the way in 2008 but were cancelled by the incoming National government, then stalled in 2019 by Labour’s coalition partner New Zealand First. (They’re supposed to be introduced in 2021.) Since 2016 there has been a large increase in road building, with further massive plans announced in February 2020. Despite the phrase “mode shift” being seen more and more frequently, there is not a lot of it about yet. Electric car sales got off to a good start in 2017, but have stalled since 2018. The total EV fleet is preventing about 50 kt a year or 0.3% of road transport emissions. Conclusion: transport policy was a failure in 2017–2019 and there are still major forces pushing emissions higher, while big battles over mode shift lie ahead.
International aviation (up 582 kt) is not in the ETS and it is also exempt from GST and fuel excise tax. Together these have contributed to make it one of our largest emission sectors. Covid has wiped it out, reducing emissions by 90%, but there are no measures in place to prevent it returning in full.
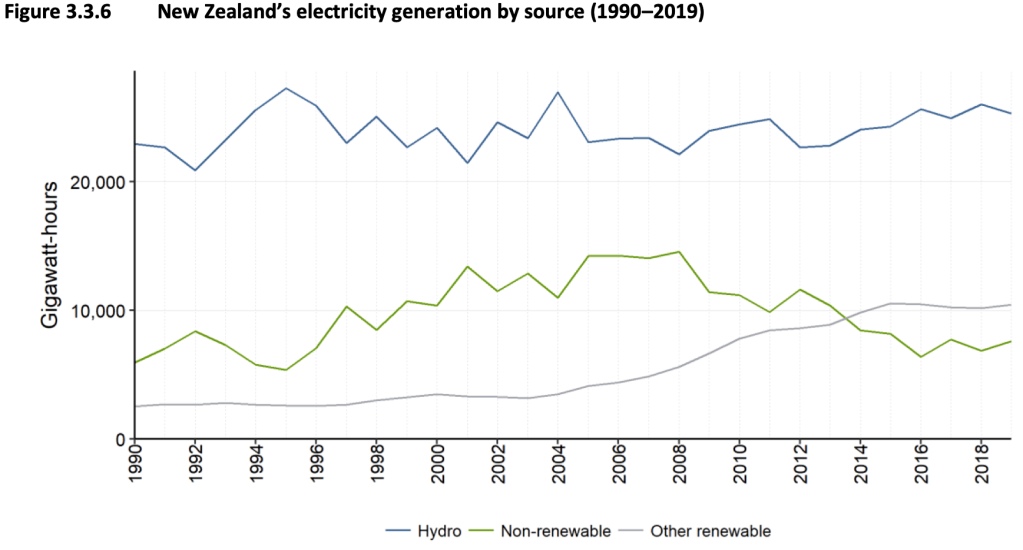
Electricity (up 1142 kt) is in the ETS and is very sensitive to the price of carbon. A carbon price of $25 adds 2.5 cents per kWh to the price of electricity. There are cheap alternatives to fossil fuels and higher renewable energy targets have been in place for many years. So why have emissions blown out? The Ministry for the Environment blame the weather (“lower levels of hydro generation”). But that isn’t the whole story.
It’s true that hydro generation does fluctuate. But looking at the long-term trends, new renewable energy construction came to a complete stop in 2016. If it hadn’t, emissions would have fallen significantly. Wholesale electricity prices were low in 2016 (6c/kWh), but by 2019 they were at record highs (13c/kWh) and companies started to plan new renewable power stations. (A bit late: in 2021 prices are over 20c and we are facing electricity shortages.) A possible conclusion is that despite what they say, electricity generators don’t really care about emissions at all.
Food processing (up 548 kt) is not fully in the ETS. Most of these emissions are from burning coal and natural gas to dry milk into milk powder. In these three years new plants and boilers were being built and operated at a great rate. A 2017 presentation from a Fonterra representative did not mention that their company was the largest consumer of coal in New Zealand. (The word “coal” does not even appear.) Since then they have changed their tune, but progress is slow. Their Brightwater plant was converted to a coal/wood blend in 2018 (emissions savings: 2 kt a year); in 2020 a larger plant at Te Awamutu converted fully to wood (savings: 83 kt a year). The Stirling cheese factory has been promising to go electric since 2018, and an announcement was expected in 2020, but there does not seem to be any decision yet. At this rate it will take a decade just to undo the past three years of growth.
And so it goes down the list. Throughout the country people were deciding to buy new fossil-fueled cars, boilers, and machinery far more than they were deciding to get rid of them. Away from the world of elections, policy reviews, school strikes, and opinion pieces, it was business as usual for three years.
So to try to answer my question, Why did New Zealand’s CO2 emissions blow out so spectacularly in 2019: the forces for increasing fossil fuel burning were vastly more powerful than the puny forces opposing them. All the talk about climate change in 2017–2019 had little effect on the behaviour of companies or individuals.
Have we turned the corner?
Possibly. The pro-fossil fuel forces are still there, but the opposing forces are gathering strength, especially through the Zero Carbon Act which for the first time includes a falling cap on emissions. In the most sensitive sector, electricity, the changes can be seen already. My takeaway from the new 2019 data is that the big four, road transport, aviation, electricity, and food processing, that are so large, that have performed so poorly, and that have so much scope for transformation, are where we need to look for change.
Looking 130 km east from Fanthams Peak, Taranaki (1966 m) to Mts Tongariro, Ngauruhoe, and Ruapehu (2797 m). Photo: Peter Laurensen, www.occasionalclimber.co.nz
Federated Mountain Clubs (FMC), founded in 1931, represents 96 clubs, 22,000 members and 300,000 people that regularly recreate in the New Zealand backcountry. This article first appeared in the June 2020 issue of Backcountry magazine and is reproduced with permission. (Read the original article). See also “EVs for mountain recreation” (Backcountry, June 2020) and a series of articles on climate change and the backcountry (November 2020).
It has been a while now – pre-Covid-19 (everything pre-Covid seems a while ago) since the FMC Executive approved a new campaign we have called ‘Recreation Transition’ to encourage low-carbon recreation.
FMC has been considering our response to the climate crisis for several years. We have taken steps to minimise our organisational carbon footprint, including the recent decision to phase out the FMC Travel Club. But the times demand more of us, so we have developed this campaign to shape our future advocacy, to attempt to impact central and local government thinking and possibly to influence the recreational choices of clubs and our wider outdoor community.
FMC recognises that in this instance we are not leaders, but followers, of many committed initiatives from clubs and individuals in our outdoor community.
Railcar about to enter the Arthur’s Pass tunnel, mid 1970s. These trains ran from 1956 to 1978 and were a legendary source of transport for trampers who would wave down the train for unscheduled pickups. The Auckland–Wellington night train fulfilled a similar function in the North Island until 1979, and is now the subject of a revival campaign. (Photo: Roy Sinclair)
Low-carbon recreation infrastructure
There is a need for low-carbon transport options for people to get to the places they love. Dan Clearwater investigates in this Backcountrywhat is possible currently with electric vehicles. Improved passenger services on railways are also important, and this government is heading in the right direction – will we see Cantabrians heading to Arthurs Pass on the train for a climb and tramp again in our lifetimes? Clubs also have, and will continue to, play a crucial role with car-pooling, club buses and other climate-friendly practices.
The push for low-carbon recreation infrastructure encompasses the creation of and investment in recreational opportunities that don’t have high embedded transport costs. How much could carbon emissions be reduced if people from Auckland and Tauranga did a yearly tramp in the Kaimai ranges rather than on a distant Great Walk? How much carbon emission reduction if the public money invested in the Paparoa track had been used instead to develop more mountain-biking opportunities near some of our larger centres of population?
From my back door
FMC coined #frommybackdoor pre-Covid, but events have overtaken us. What a lesson and opportunity we have all had to rediscover our neighbourhoods, and to think about how we can improve our local outdoor opportunities. How much could carbon emissions be reduced if more people choose to recreate from their back doors regularly? Should we apply the ‘recreational opportunity spectrum’ suburb by suburb, town by town?
Department of Conservation research has shown that the most influential factors in connecting people to nature are experience in nature as a child and regular interaction with specific natural places as an adult. Where better to make this happen than people’s own neighbourhoods? The unkempt gully, the piece of bush locked away between neighbours, the old braid of the river, the swamp on the edge of town.
A ‘from-my-backdoor’ ethic also includes self-powered journeys, be that to nearby coasts or distant mountains. Ed Hillary of course rode his bike to the hills, as did many others. A more contemporary trip I have always aspired to emulate is Erik Bradshaw’s and Jonathan Kennett’s climb of Tapuae-o-Uenuku from Wellington – by bike – in a weekend. Low-carbon outdoor recreation still allows plenty of opportunity for exploring, achieving ambitious trips and developing skills.
The actual bicycle ridden by Edmund Hillary and Julian Godwin in the 1940s. “”Godwin’s best mate in the RAF was Ed Hillary and on weekends they would ‘double’ each other out to Mt Taranaki and have a crack at the mountain,” said Jecks, recalling what Godwin had told him. In Hillary’s autobiography, there are several mentions of Julian Godwin and even a reference to this very bicycle.” (Photo: Emma James/Fairfax)
Layers of Experience
‘Layers in the outdoors’ usually refers to poly-pro and fleece. Two of each and a good raincoat is my ‘handle anything’ kit. ‘Layers of experience’ might bring to mind those forehead wrinkles and calm that comes with enduring a few challenges in your time. In this case though, FMC is talking about the richness to be gained from a multi- layered experience in a place, beyond what you get from briefly passing through. We are talking about going beyond just ticking another place off your list or taking your photo for instagram.
Layers of experience may include: skill development, sense of community, contribution to the place – say through conservation volunteering – artistic endeavour, mentoring and increased knowledge in various fields. This is a richness which many clubs have done well to preserve, but which has been lost to much of our outdoor community, who have been herded instead from carparks, along gravel tracks, to well-worn destinations. It is a richness that may help people confidently choose to recreate #frommybackdoor and indeed to generally live more lightly upon the earth.
Family Tramping
FMC has had a focus this past year on family tramping, the joy of parents introducing their children to the outdoors. What if we look at this opportunity anew through a recreation transition lens? Can we family tramp from our back doors, after a short drive, or from a railway station?
Wellington’s Ōrongorongo valley is a long-standing outdoor recreation success with its mix of bookable and non-bookable huts, close to each other but incredibly well used and cost-effective for servicing and maintenance. Is this a model worth replicating elsewhere? In say the Glentui/Mt Richardson area, Waitawheta River, or at an appropriate spot in the Hūnua Ranges?
Do we need to design multi-day trips for little legs – were DOC’s previous policies to remove front-country huts and ensure minimum distances between huts short-sighted? Do we need to think more about providing appropriate loops in our most accessible places? Could we do more to encourage camping during what we now call day-trips?
There will no doubt always be a place for journeys to remote road ends and mysterious ranges out the back of beyond, but maybe we can make more of the opportunities close to home as well.