
By Robert McLachlan
Climate solutions are often judged not just by whether they work – that is, by whether they reduce emissions – but also by whether they support a “just transition”. As Sam Huggard of the New Zealand Council of Trade Unions writes, “the costs of the necessary changes that deliver all of us a more stable climate must be spread evenly and not fall heavily and disproportionately on workers, particularly those in carbon-exposed industries.” New Zealand has joined international declarations to that effect, and set up a “Just Transitions” unit in the civil service, to ensure that the process is “fair, equitable and inclusive [and] that the Government works in partnership with iwi, communities, regions and sectors to manage the impacts and maximise the opportunities of the changes brought about by the transition to a low emissions economy.“
All well and good. But what is “fair”? It’s easier to detect things that are unfair, like a large and sudden petrol tax. People whose only available choice is to commute long distances in cheap gas guzzlers would bear the brunt, while wealthy inner-city dwellers could continue to clog up the roads in their Teslas. Most would agree that we don’t want anything as unfair as that and that it’s worth looking for another way.
I want to turn things around and look, not at the impacts on poor people, who generally have low personal emissions and less ability to change them, but at the rich high-emitters.
The Paris Agreement, after all, is founded on the principle of equity, and the “common but differentiated responsibilities and respective capabilities” of the nations. Just what those are is open to debate, but this clause is generally held to mean that countries with high historical emissions – the ones that caused this problem – and rich countries, that have more scope and power to reduce emissions, should move faster than others.
How about within countries? Should rich people, and/or high-emitting people, pay proportionately more towards a country’s transition, and reduce emissions more than others?
How are carbon emissions distributed?
To begin to get a handle on this thorny question we first need to know the distribution of emissions within individual countries. A 2020 paper by Diana Ivanova and Richard Wood (“The unequal distribution of household carbon footprints in Europe and its link to sustainability“) looks at this for 26 EU countries. (The data comes from a survey of the expenditure of 275,000 households carried out in 2010, mapped into greenhouse gas emissions for each type of spending.)
Household emissions measure the emissions related to final consumption, wherever the actual greenhouse gases were emitted. The EU as a whole produces impressively low greenhouse gas emissions of 8 tCO2e per person, a lot lower than New Zealand’s 16.5 tCO2e. But many EU countries effectively import emissions by buying things from other countries, such as China. Imports take the UK’s 6.8 tCO2e per person up to 9.6 tonnes, and Germany’s 9.6 tonnes up to 11. New Zealand, a net exporter of greenhouse gases, consumes 12.5 tonnes per person. Of these 12.5 tonnes, 8.9 tonnes are assigned to households.
Here are Ivanova and Wood’s overall results:

The lowest-emitting half of EU households emit an average of 5 tonnes per person; the middle 40%, 10 tonnes; the top 10%, 23 tonnes; and the top 1%, a whopping 55 tonnes CO2e per person.
Air travel is strikingly unevenly distributed. 90% of EU households have air travel emissions averaging 0.1 tonnes per person; 9% average 0.8 tonnes; and the last 1% average 22.6 tonnes. That’s enough to fly around the world five times (or once in business class). This is confirmed in the breakdown by household expenditure:

Emissions from essential items (food and housing) increase more slowly that total spending: there’s a limit to how much food you need. Emissions from goods, services, and land transport increase in tandem with total spending, while emissions from air travel increases very little in the lower quintiles but very rapidly in the top two. The authors write that this “confirms air travel as a highly carbon-intensive luxury” and describe transport as “one of the most unequally distributed and the strongest drivers of the carbon footprints of the rich“.
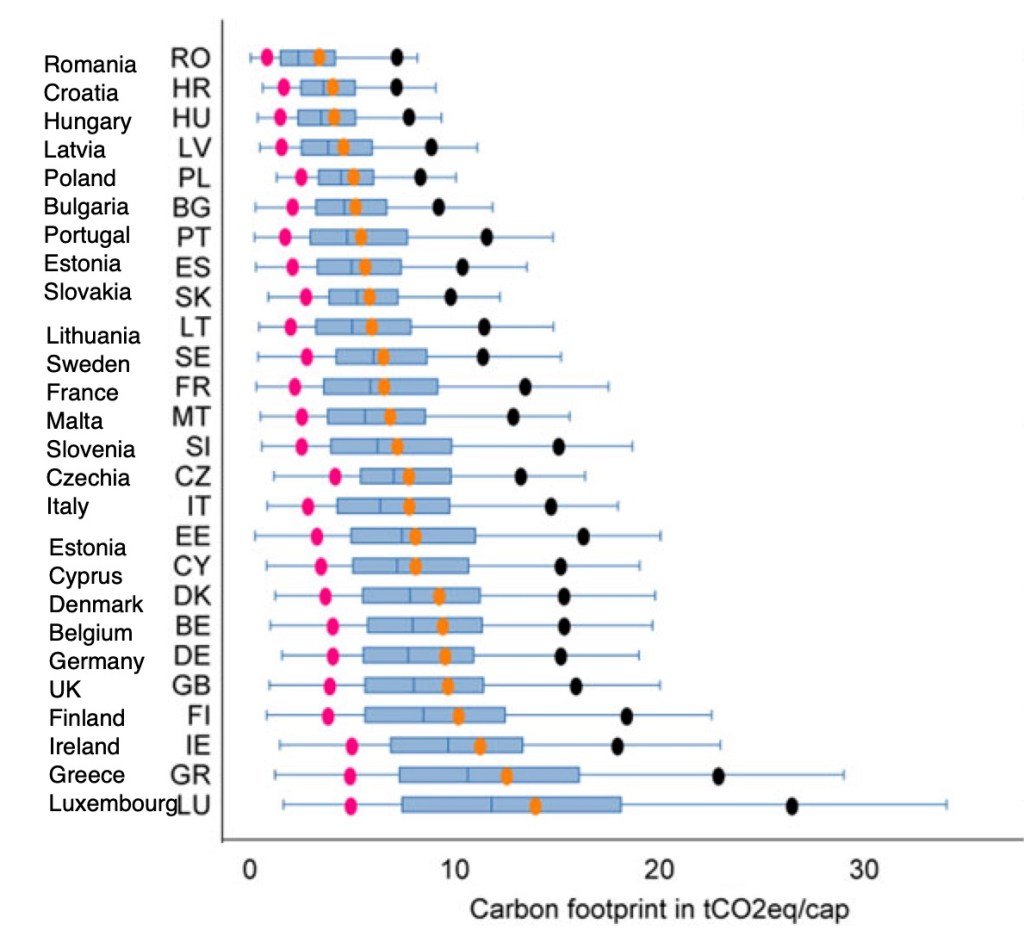
They also report the distribution of household emissions across countries. For most countries these track very closely to the distribution of income:
55 tonnes per person may seem like a lot, but it is confirmed by other studies. A 2015 paper by Lucas Chancel and Thomas Piketty (“Carbon and inequality: From Kyoto to Paris“) found that the top 1% of Americans emit 318 tonnes CO2e each per year. They put the emissions of the top 1% globally at 56 tonnes a year. (They get slightly higher figures than Ivanova and Wood, because they include all emissions and all income, not just those tagged to household consumption.)
The extremely skewed distribution of air travel is also reported by Stefan Gössling and Andreas Humpe, in “The global scale, distribution and growth of aviation: Implications for climate change” (2020). They find that in any given year 1% of the world’s population are extremely frequent flyers, emitting 10 tonnes CO2 each on average and causing half of all aviation emissions; another 10% fly less and emit 1 tonne CO2; and the remaining 89% do not fly at all. People with access to one of the world’s 22,000 private jets could be associated with emissions of 7500 tonnes each. Even in rich countries like the US and Germany, and rich islands like Taiwan, less than half the population flies in any particular year.
One final report, by Oxfam in 2020, “Confronting carbon inequality: Putting climate justice at the heart of the Covid-19 recovery“, reaches a similar conclusion. Oxfam find that the richest 1% globally have emissions of 74 tonnes of CO2 per person on average, adding up to 15% of all emissions.
Where does New Zealand fit into all this?
Statistics New Zealand have calculated consumption emissions by household for 2017. They only report the average, not the distribution, so I will try to relate the New Zealand figures to the EU study.
The median take-home income in New Zealand is $41,500 per person. Adjusted for purchasing power that comes to €19,300, above the EU median of €17,300, and similar to countries that we think of as ‘rich’, like Ireland and Finland, and above the UK.
I’ll compare New Zealand’s average household emissions to those of a median EU household.
| New Zealand 2017 | EU 2010 | |
| Food | 2.5 | 1.5 |
| Housing | 1.4 | 2.1 |
| Clothing | 0.24 | 0.4 |
| Services | 0.5 | 0.6 |
| Manufactured products | 0.95 | 0.8 |
| Land travel | 2.3 | 2.4 |
| Air travel | 1.0 | 0.17 |
| Total | 8.9 | 9.4 |
We have higher food emissions – I’m not sure why, although the 2.5 tCO2/person figure does agree with another study by Drew. We have lower housing emissions, which makes sense because our electricity is cleaner and we don’t heat our homes with gas (some would say we hardly heat them at all.) Consumption of “stuff” as about the same, as is (surprisingly), land travel. We fly six times as much.
One way to measure income distribution is by the ratio of the total income of the richest 20% to the total income of the poorest 20%. For New Zealand, this ratio is 5.6. For the UK is is 6.1, for Germany 4.4, and for the EU as a whole it is 5.0 – all in the same ballpark.
Therefore, my first estimate is that the emissions of New Zealand households are distributed very unequally. Given our high air travel emissions, and the high elasticity of air travel amongst rich people, it’s likely that our top 1% and top 10% of households have very high emissions indeed. The distribution may look similar to that of Great Britain, shown above.
A second line of attack views New Zealand in light of Piketty’s global income distribution. A take-home income of $75,000 per person puts you globally in the top 1%, which, as we have seen, have sky-high emissions of 56 tonnes per person. In New Zealand, 12.3% of households reach that income level. (Technically, this is net income per ‘equivalent adult’, in which children under 14 count as 0.3 and children 14-17 count as 0.5 adults.) New Zealand’s top 5% ($100K) have similar purchasing power to the top 5% in the richer European countries (~€50K). This also points to distributions similar to those found in the EU.
What then?
The authors of the four studies quoted above have some suggestions.
Oxfam call for
special taxes or bans for high carbon luxury goods and services; wider carbon prices with pro-poor revenue recycling; broader income and wealth redistribution; or challenging stereotypes that promote growth and individual consumerism as normal, desirable, ‘powerful’ and ‘masculine’… such measures may lead to a broader ‘social tipping point’ that makes reductions by other relatively high emitters more acceptable, challenges the political influence of high emitters, and sparks wider shifts in social, gendered and racial norms about endless consumption.
Gössling, on aviation, writes:
Emissions Trading Schemes are inappropriate for a sector in which the distribution of air transport demand and associated emissions is more highly skewed than in other areas of consumption. From a market-based viewpoint, a modest increase in the cost of air travel will not affect business travelers, who are causing disproportionally high emissions… [we] need to develop more complex transition policies for aviation.
Ivanova and Wood:
The contributions of land and air transport are disproportionally large among the top emitters. As land transport and, even more so, air transport are both highly carbon intensive and highly elastic, we would argue that significantly more needs to be done in these domains. Action here is likely to affect those with the highest footprints, incomes and expenditures most, but impacts on low-income groups are also key, as they have significant expenditure shares on land transport.
Overconsumption and materialistic practices are not only damaging for the environment, but may also reduce psychological well-being. In order to reduce trade-offs between social and environmental goals, policies should target changes in higher-order need satisfiers, such as social structures and practices, and reimagine forms of need satisfaction within environmental constraints.
Chancel and Piketty suggest a global progressive carbon tax for above-average emitters, to fund climate initiatives globally, or, failing that (for they acknowledge this is unlikely), progressive income taxes, or a global tax on air tickets of about €20 per 1000 km.
Whichever way you slice it, aviation is a problem. It’s a luxury good that has managed to sell itself as essential, and to be above reining in. International air travel escapes all GST, fuel taxes, and emissions trading schemes, even in places that otherwise have them. Its use is highly skewed towards the rich, even within rich countries, and it has shown very high growth rates over long periods.
The problem is not just that the high emitters have to pay more towards the transition, even more as a proportion of their income: that’s not that controversial, it’s already embedded in progressive income taxes to some extent. The harder problem is that they actually have to reduce their emissions, which means way fewer luxury cars and much less air travel. Ivanova and Wood regard a target of 2.5 tonnes per person by 2030 as consistent with the Paris agreement. (Oxfam say 2.1 tonnes). That means average emissions falling by 70%. But the bottom half of emitters can’t reduce by very much at all, which means the top half have to do more.
Which brings me right back where I started: Should rich people, and/or high-emitting people, pay proportionately more towards a country’s transition, and reduce emissions more than others? And if so, how?

Great article. Thank you.
Kevin Anderson, one time director of the Tyndall Centre for Climate Change Research and now Professor of Energy and Climate Change at Manchester, reckons we need to go on to a war footing.
Call ’em up and sort ’em out.