By Robert McLachlan
Every year in April, the trees start changing colour, the clocks go back an hour, and the national greenhouse gas figures are released and promptly forgotten.
They take fifteen months to prepare, so by the time they come out it’s very easy for commentators to point out that they are out of date. Even now that the national media are running several new climate change stories every day, this one seems to pass us by. Not only are the figures out of date, they are also highly technical and hard to interpret: the year-to-year changes might be influenced by one-off factors like the weather, while the long-term trends have been subject to the changing winds of climate policy.
The Ministry for the Environment does an amazingly thorough job of reporting greenhouse gas emissions. The latest release includes a 633 page report accompanied by 100 MB of data – 300 spreadsheets in all. But as for interpreting the data, they don’t go very far:
Between 2018 and 2019, gross emissions increased by 2 per cent, which was largely attributed to an increase in emissions from the energy sector (by 5 per cent ot 1,711 kt CO2-e) drive mainly by an increase in emissions from manufacturing industries and construction, largely due to an increase in methanol production, and an increase in emissions from public electricity and heat production, primarily driven by an increase in natural gas-fired and coal-fired electricity generation in response to lower levels of hydro generation.
The “energy sector” is exactly the part we’re supposed to be focusing on. A 5% increase in one year, unless it’s some sort of one-off exception, is disastrous. We need to be cutting those energy emissions by at least 5% a year. The Ministry makes is sound like those increases just happened. But how can that be, when we’re in an emergency and climate politics is front and centre? What’s the relationship between emissions and climate policies?
CO2 emissions reach record highs
To try and get a grip on recent trends, I’m going to look at the changes from 2016 to 2019. Gross CO2 emissions did at first fall over the past decade, from 41.2 Mt in 2008 to 38.3 Mt in 2016, before rising again to 42.2 Mt in 2019. This turnaround is a worry and could indicate that climate policy over the period has failed. The three years 2017 to 2019 saw a massively increased focus on climate change: September 2017 saw Labour returned after a decade in a strikingly climate-led election. A Zero Carbon Bill (originating with the youth climate movement Generation Zero) was promised and extensively debated over 2018 and 2019, becoming law in November 2019.
Meanwhile, Greta Thunberg burst onto the world stage in late 2018, leading to massive School Strikes 4 Climate throughout New Zealand and the world in 2019. Climate emergencies were declared throughout the country, and eventually by Parliament itself.
Surely anyone even tangentially involved with fossil fuels would have realised that change was coming?
In fact, change had already been signalled before the 2017 election. The 2008 Emissions Trading Scheme, which had been weakened almost as soon as it was introduced, began to return to its original plan, with a 50% discount being removed during 2017 and 2018. Carbon prices rose, perhaps indicating that emitters expected to face more restrictions:
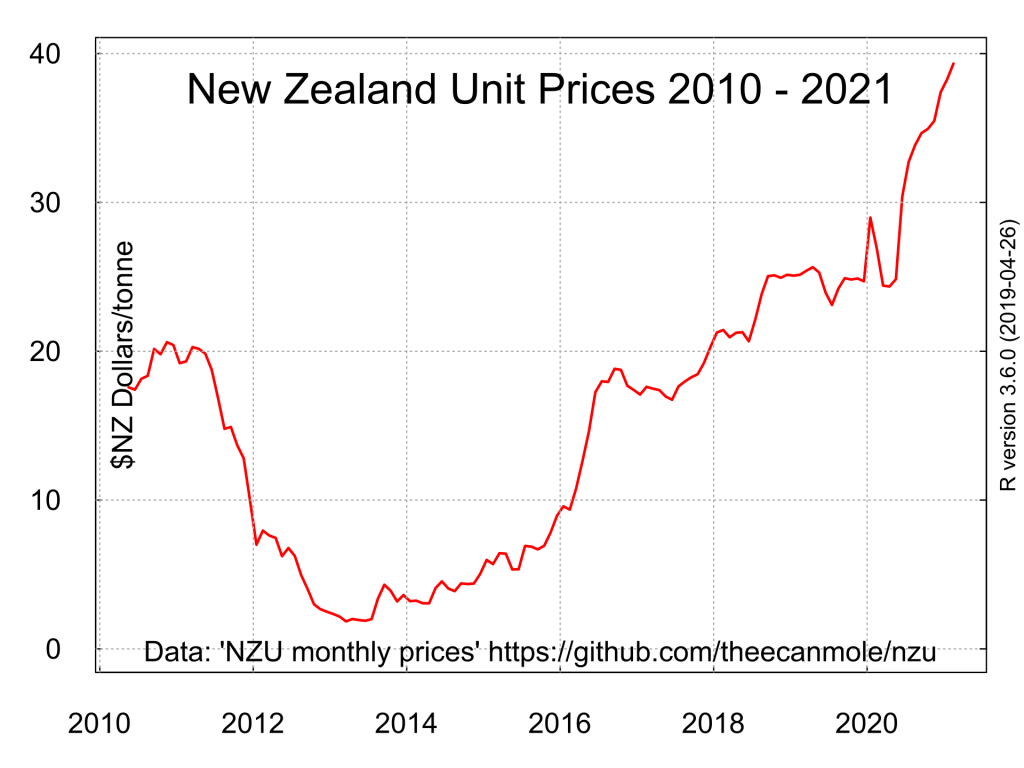
Although on the surface it looks like carbon prices tripled during 2017-2019, it is difficult or impossible to know how much emitters actually paid. Several years worth of credits have been banked ahead of time, many bought when prices were much lower, and many imported from Russia and Ukraine in dodgy deals: as the “low integrity” of these carbon credits became known, New Zealand companies were left as the only buyers, leading to very, very low prices (and an end to international carbon trading). In addition, many large emitters get 60% or 90% discounts, to protect them from international competition. The only large sectors that are fully exposed to the ETS are domestic transport and electricity.
Emissions up 10% in three years
| CO2 emissions (kilotonnes) | 2016 | 2019 | Change | Fully in ETS? | |
|---|---|---|---|---|---|
| Road transport | 13462 | 14560 | +1098 | +8% | Yes |
| International aviation | 3274 | 3856 | +582 | +18% | |
| Electricity | 3029 | 4171 | +1142 | +38% | Yes |
| Food processing (dairy) | 2689 | 3237 | +548 | +20% | |
| Metal industry (70% steel, 30% aluminium) | 2251 | 2236 | -15 | -1% | |
| Chemicals (mostly methanol) | 1999 | 1875 | -123 | -6% | |
| Agricultural industry, forestry, and fishing | 1370 | 1430 | +60 | +4% | |
| Fugitive fossil fuel emissions | 1239 | 1021 | -218 | -18% | Yes |
| Agriculture (50% lime, 50% urea) | 1089 | 1117 | 28 | +3% | |
| Mining & other industry | 1022 | 1194 | +172 | +17% | |
| Commercial buildings | 995 | 1130 | +135 | +14% | Yes |
| International shipping | 943 | 1009 | +66 | +7% | |
| Domestic aviation | 919 | 1015 | +97 | +11% | Yes |
| Oil refining | 847 | 882 | +34 | +4% | Yes |
| Non-metallic minerals: energy (cement, lime, glass) | 727 | 618 | -109 | -15% | |
| Residential buildings | 585 | 628 | +44 | +8% | Yes |
| Non-metallic minerals: industrial processes | 466 | 596 | +130 | +28% | |
| Pulp, paper, and print | 381 | 421 | +40 | +10% | |
| Manufacture of solid fuel | 291 | 354 | +63 | +22% | Yes |
| Domestic shipping | 270 | 329 | +59 | +22% | Yes |
| Chemical industry (hydrogen, ammonia) | 191 | 183 | -8 | -4% | |
| Iron and steel industries | 176 | 190 | +14 | +8% | |
| Rail transport | 129 | 126 | -3 | -2% | Yes |
| Total CO2 | 38343 | 42180 | +3836 | +10% |
Let’s look at the big four.
Road transport (up 1098 kt CO2) is in the ETS, but a carbon price is a terrible way to reduce emissions in this sector. Even $50/tonne only adds 10 cents per litre to the price of fuel, which itself is only weakly linked to people’s transport decisions. The main causes of the rise in emissions are the almost exclusively car-focussed transport system, which has left us with the highest rate of car ownership in the OECD, and a lack of fuel efficiency standards. These had been on the way in 2008 but were cancelled by the incoming National government, then stalled in 2019 by Labour’s coalition partner New Zealand First. (They’re supposed to be introduced in 2021.) Since 2016 there has been a large increase in road building, with further massive plans announced in February 2020. Despite the phrase “mode shift” being seen more and more frequently, there is not a lot of it about yet. Electric car sales got off to a good start in 2017, but have stalled since 2018. The total EV fleet is preventing about 50 kt a year or 0.3% of road transport emissions. Conclusion: transport policy was a failure in 2017–2019 and there are still major forces pushing emissions higher, while big battles over mode shift lie ahead.
International aviation (up 582 kt) is not in the ETS and it is also exempt from GST and fuel excise tax. Together these have contributed to make it one of our largest emission sectors. Covid has wiped it out, reducing emissions by 90%, but there are no measures in place to prevent it returning in full.
Electricity (up 1142 kt) is in the ETS and is very sensitive to the price of carbon. A carbon price of $25 adds 2.5 cents per kWh to the price of electricity. There are cheap alternatives to fossil fuels and higher renewable energy targets have been in place for many years. So why have emissions blown out? The Ministry for the Environment blame the weather (“lower levels of hydro generation”). But that isn’t the whole story.
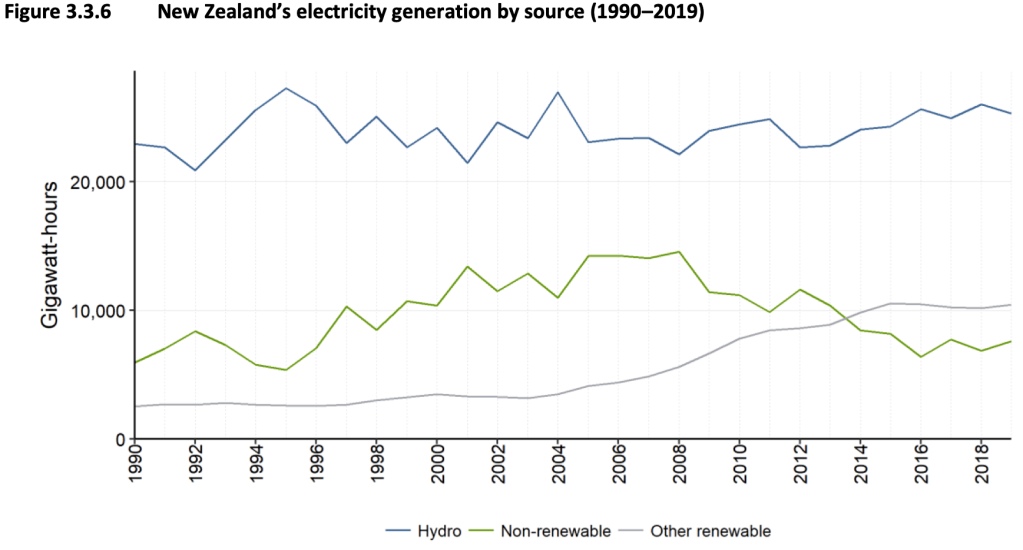
It’s true that hydro generation does fluctuate. But looking at the long-term trends, new renewable energy construction came to a complete stop in 2016. If it hadn’t, emissions would have fallen significantly. Wholesale electricity prices were low in 2016 (6c/kWh), but by 2019 they were at record highs (13c/kWh) and companies started to plan new renewable power stations. (A bit late: in 2021 prices are over 20c and we are facing electricity shortages.) A possible conclusion is that despite what they say, electricity generators don’t really care about emissions at all.
Food processing (up 548 kt) is not fully in the ETS. Most of these emissions are from burning coal and natural gas to dry milk into milk powder. In these three years new plants and boilers were being built and operated at a great rate. A 2017 presentation from a Fonterra representative did not mention that their company was the largest consumer of coal in New Zealand. (The word “coal” does not even appear.) Since then they have changed their tune, but progress is slow. Their Brightwater plant was converted to a coal/wood blend in 2018 (emissions savings: 2 kt a year); in 2020 a larger plant at Te Awamutu converted fully to wood (savings: 83 kt a year). The Stirling cheese factory has been promising to go electric since 2018, and an announcement was expected in 2020, but there does not seem to be any decision yet. At this rate it will take a decade just to undo the past three years of growth.
And so it goes down the list. Throughout the country people were deciding to buy new fossil-fueled cars, boilers, and machinery far more than they were deciding to get rid of them. Away from the world of elections, policy reviews, school strikes, and opinion pieces, it was business as usual for three years.
So to try to answer my question, Why did New Zealand’s CO2 emissions blow out so spectacularly in 2019: the forces for increasing fossil fuel burning were vastly more powerful than the puny forces opposing them. All the talk about climate change in 2017–2019 had little effect on the behaviour of companies or individuals.
Have we turned the corner?
Possibly. The pro-fossil fuel forces are still there, but the opposing forces are gathering strength, especially through the Zero Carbon Act which for the first time includes a falling cap on emissions. In the most sensitive sector, electricity, the changes can be seen already. My takeaway from the new 2019 data is that the big four, road transport, aviation, electricity, and food processing, that are so large, that have performed so poorly, and that have so much scope for transformation, are where we need to look for change.

Keep up this important work and testimony – thanks.