By Robert McLachlan
NIWA’s ‘7-station series’ shows warming of 1.11 ºC per century:
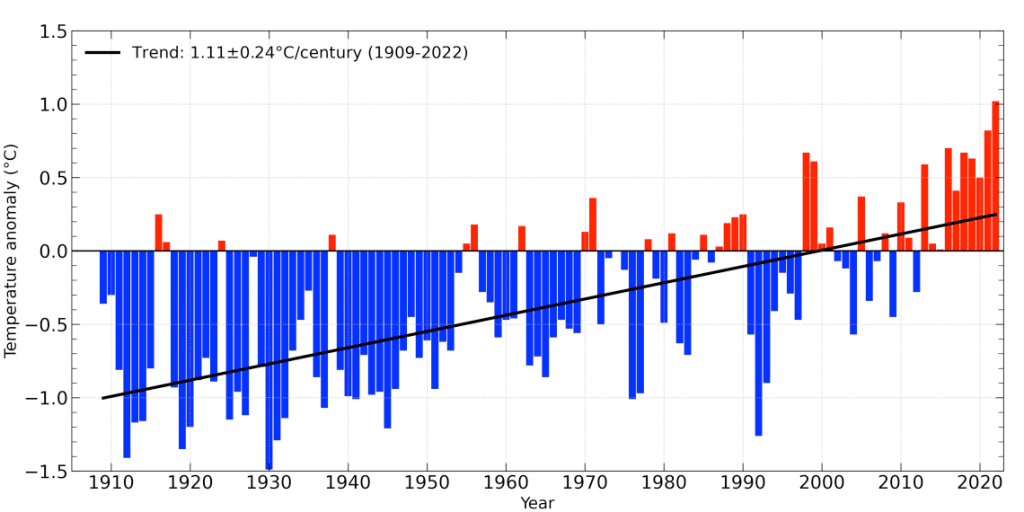
But is that straight line a sound model of the trend?
Recently, Berkeley Earth released preliminary data for all countries in the world. Although based on data from 86 sites, rather than 7, it gives very similar results to NIWA:
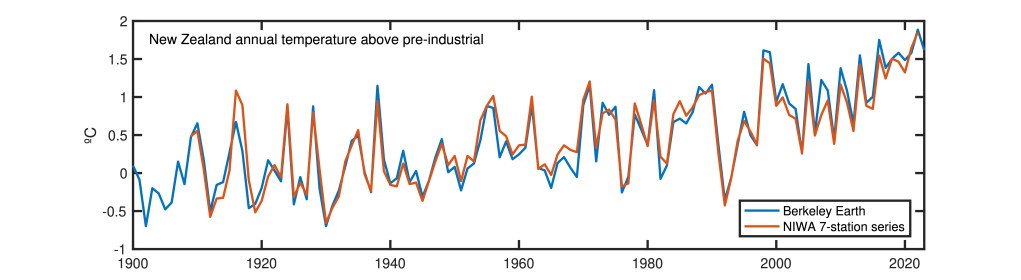
Smoothing the data shows the underlying trend:

Some years stand out well above the trend. 1938 was particularly warm, at 1.15 ºC above pre-industrial, a record that would not be matched again until 1971. In April 1938,
So much sediment washed into the river that the Esk Valley was left covered in silt one to three metres deep when the floodwaters subsided. The water was more than two metres over the floor of the Eskdale Railway Station, and silt lay 1.6 metres deep. The silt was dug out of some houses but the old road running up the valley remains buried beneath the road since built over it. Once the silt had consolidated on farmland, new fences were installed; some posts were placed on top of the old buried posts.


1992 was particularly cold, at –0.36 ºC, a return to pre-WWII temperatures caused by the eruption of Mt Pinatubo in the Philippines. The effect on New Zealand (1 ºC below the trend for those years) was twice the world average. Kane Hartill recalled:
1992… Amazing year, a rigorously cold winter. I was studying geology at Canterbury, and spending plenty of time doing ski-mountaineering trips to Cook and the Canterbury ranges. It seemed most of the year was drab grey with bone chilling damp cold southerly quarter winds… On one visit to Mt Hutt in late August the snow wall on the side of the access road was just over double bus height, about 8 meters. The upper T-bar lift line was cut down deep into the snow pack, there were 4-5 meter walls of snow each side along much of the ascent. I snowboarded with ice axe in hand from the summit of Mt Rolleston down the Otira valley to beyond the footbridge >5km. Then in the summer we used to go snowboarding on the permanent ice field in the upper Otira valley… it became hollowed out with caves through the later 90’s and disappeared. Pity, the most accessible ice caves in NZ at the time, 30-45min walking track from the highway… they were stunning blue like the Iceland ones.
The smoothed temperature record provides an estimate of the rate of warming:
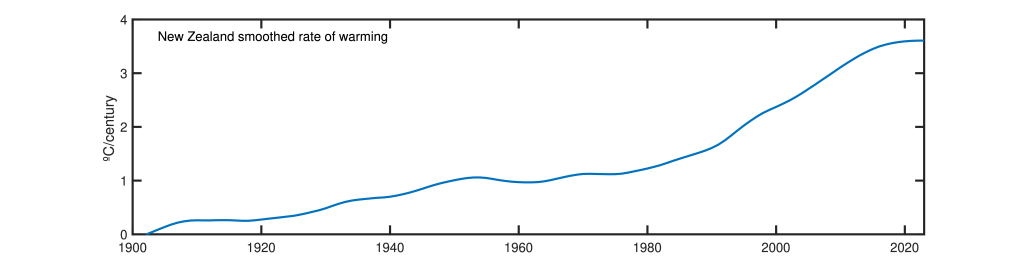
The warming appears to accelerate fairly steadily until about 1990, rising from zero to about 1 ºC/century. Then the rate of acceleration triples, with the warming rate increasing to over 3 ºC/century today. Because of the small land area and resulting variability, this estimate is pretty rough. But it is consistent with the global rate, which is also around 3 ºC/century. An acceleration to that kind of rate is expected under a medium-emissions scenario. On the other hand, warming stops when emissions stop.
Overall, New Zealand saw 0.89 ºC of warming in the 20th century, and another 0.73 ºC since 2000. The total, +1.6 ºC, is closer to the world average for land (+1.9 ºC) than for ocean (+0.9 ºC).

Warming stops when emissions stop – assuming no tipping points reached!
A large group of scientists, engineers and mathematicians at a very posh conference were betting on how long an ice sculpture would last. The winner was … the waiter. None of the others had seen one disintegrate before.
Say Lake Onslow pumped-hydro station cost $20bn.