Driving in the wrong direction: why NZ’s oil consumption is at a 5‑year high

By Robert McLachlan

Getty Images

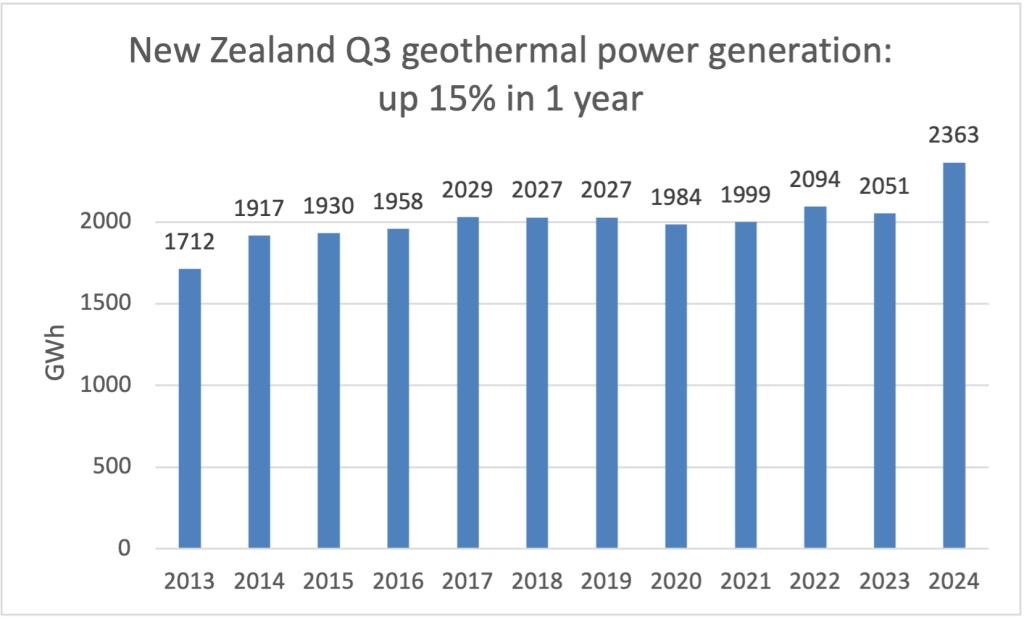
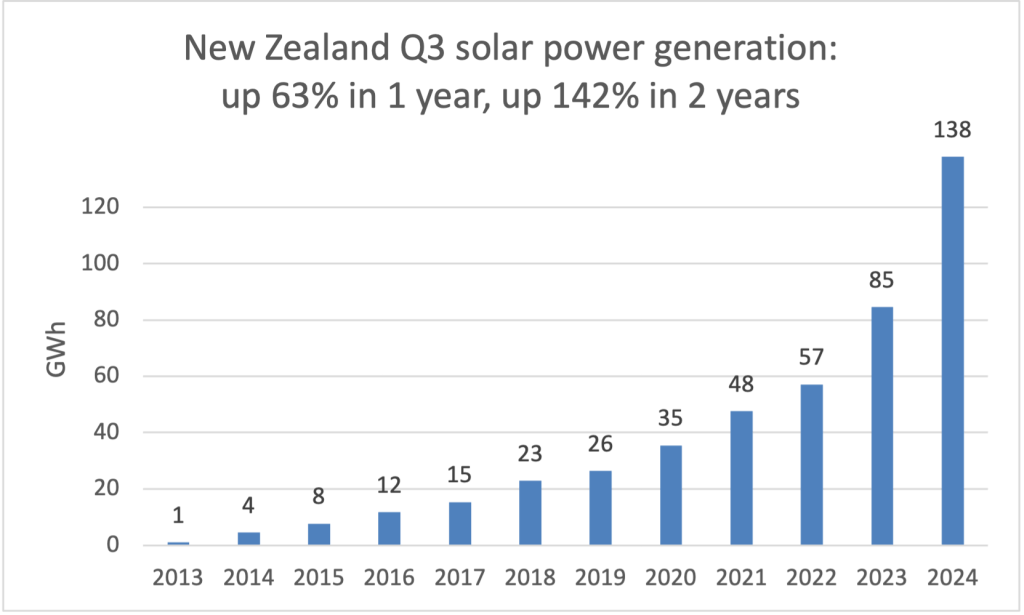
New Zealand’s latest quarterly energy report shows electricity production was above 90% renewable and emissions from generation fell to the lowest level on record.

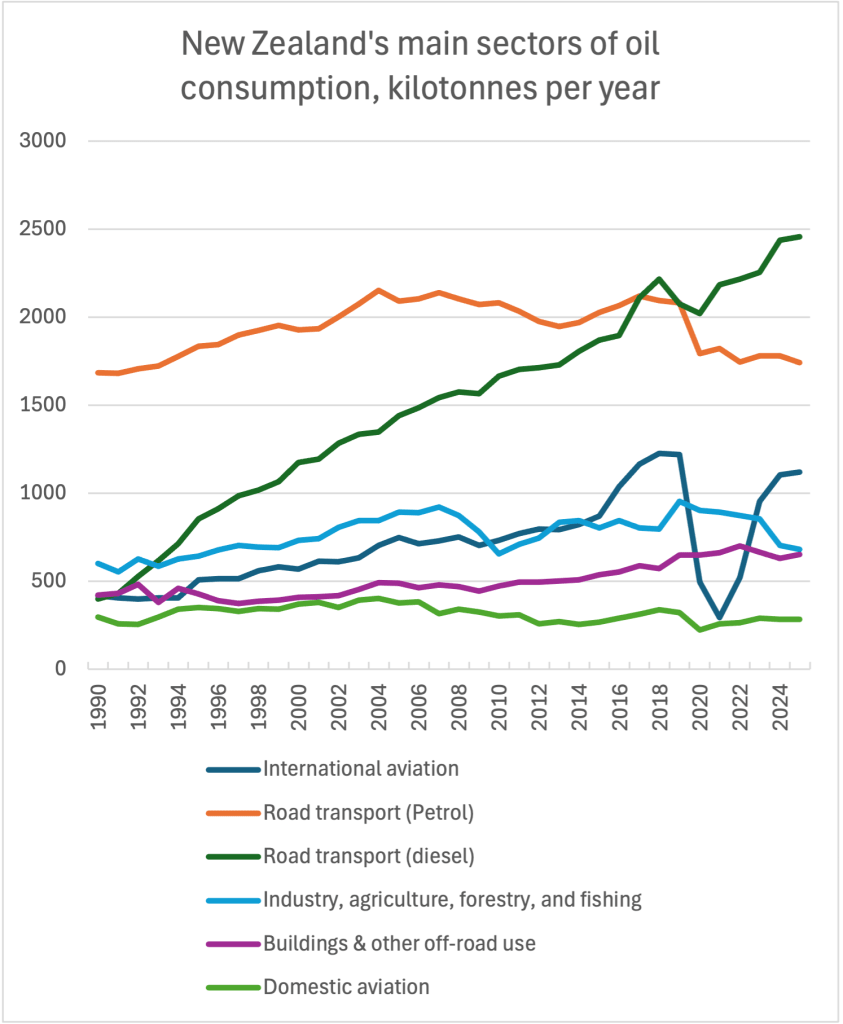
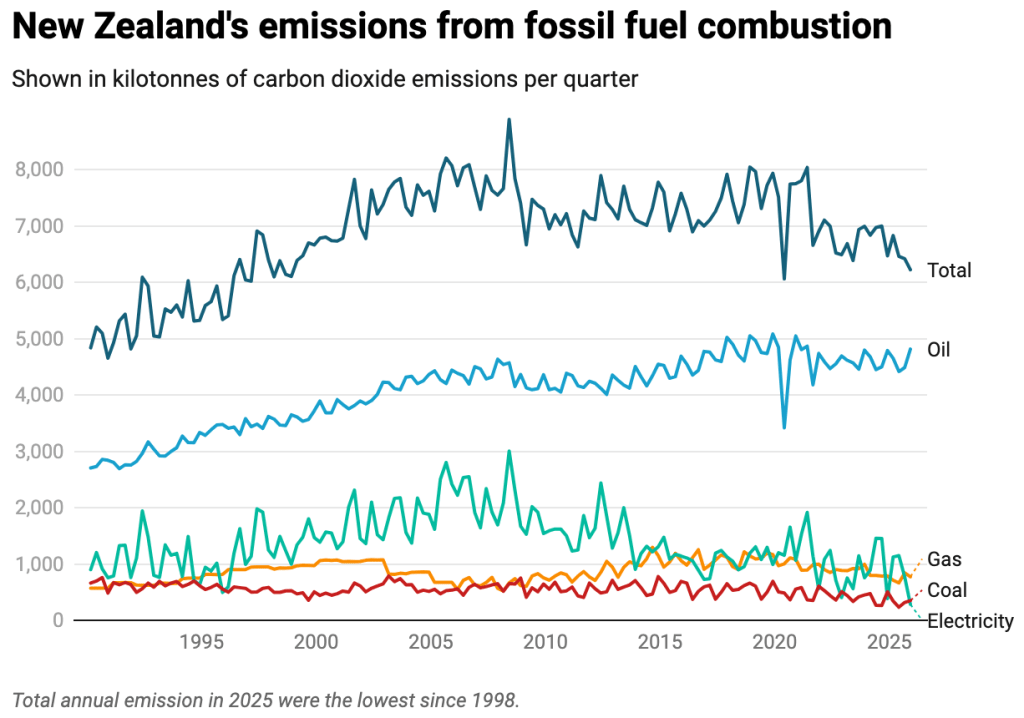
But it also shows New Zealand’s oil consumption, which had fallen markedly after the COVID pandemic, has crept back up to reach its highest quarterly level in five years.

Oil now comprises its highest quarterly share of New Zealand’s overall energy emissions on record.

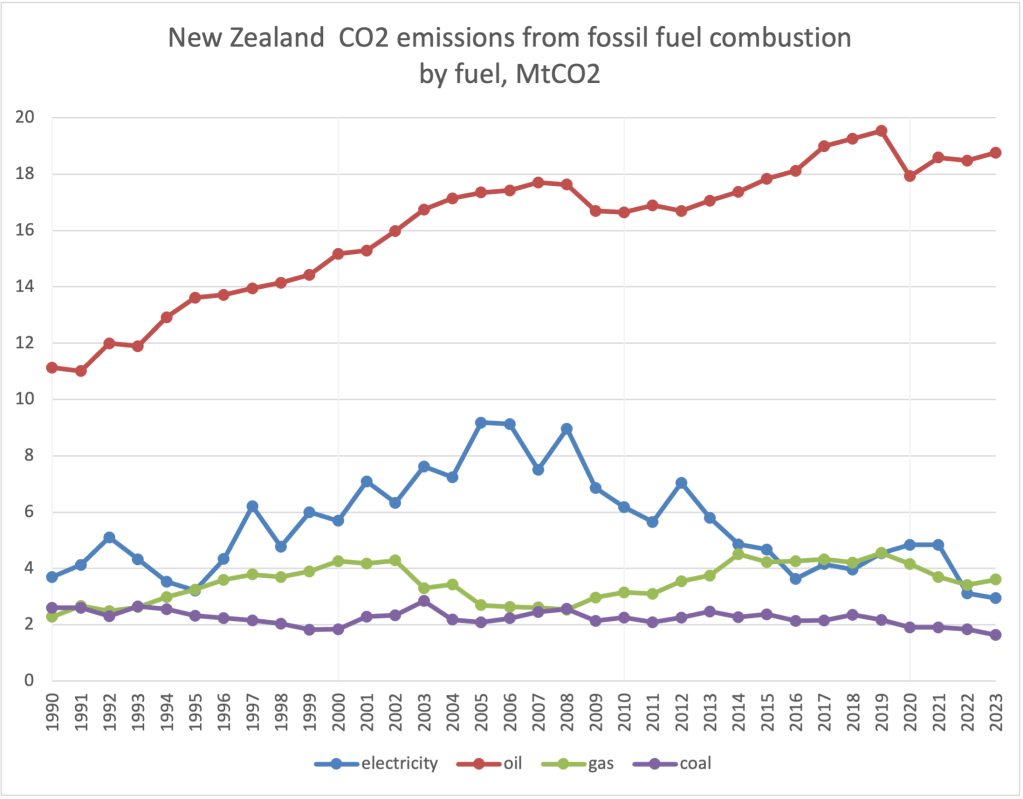
Of the total carbon emissions from the burning of fossil fuels, 77% were from oil (mostly used for transport), 12% from industrial and domestic gas usage, 6% from coal, and just 5% from electricity generation.

Source: MBIE Energy Quarterly

Developing a coordinated energy strategy to reduce oil dependence would not only provide an effective climate response, but also protect New Zealand from recurring oil price and supply shocks.

The previous government had committed to a comprehensive strategy to transition to a renewable energy system in New Zealand’s first emissions reduction plan in 2022.

But the current government’s focus has shifted on energy security and it aims to boost energy supply by importing liquefied natural gas.

Missed opportunities to reduce oil dependence

Parts of New Zealand’s economy, particularly inflation and tourism, remain strongly linked to the price of oil.

During two previous periods of high oil prices, New Zealand missed the chance to weaken the country’s dependence on oil.

The 1978 oil shock was a severe hit to the economy; New Zealand’s oil consumption did not recover to its previous level until 1990.

The soaring oil prices hit New Zealand at a time of extensive government control of the economy under the National government of Robert Muldoon, whose “Think Big” strategy included building an experimental plant to produce petrol from natural gas.

This was intended to build energy independence, but unfortunately it proved to be costly and ineffective.

The 2008 financial crisis also involved extreme oil price spikes and a prolonged recession. Oil consumption did not recover until 2015. One planned response was to introduce fuel economy standards for new cars – a form of regulation already in place in most OECD countries.

Had these standards been put in place and gradually strengthened over time, New Zealand would now be in a much better place, with less pollution and less economic dependence on oil.

However, a change in government in late 2008 led to the cancellation of the planned standards. New Zealand now uses nearly twice as much transport oil per capita as the UK, where such standards have been in place since 2001.

New law changed NZ’s trajectory

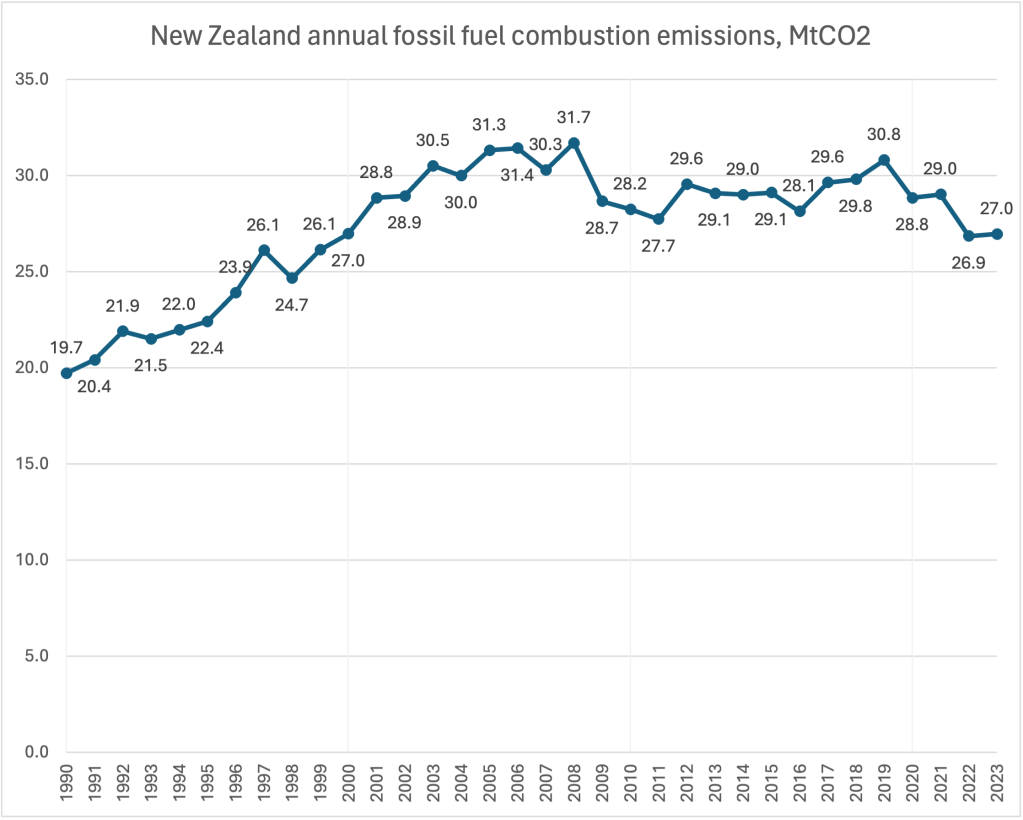
The Climate Change Response (Zero Carbon) Amendment Act of 2019 was a turning point. Before that, total fossil fuel emissions were flat or trending up. Afterwards, a wave of investments in renewable electricity, in the decarbonisation of industry and in low-emission transport turned the trend around.

This was perhaps not just due to the specifics of the act, which includes five-yearly carbon budgets, but to strong pro-climate signalling from the government of the day.

A critical mass of society, from car buyers and dealers to New Zealand’s biggest companies, were investing to take steps away from fossil fuels.

Under the current government, both messaging and policy have changed. As Climate Change Minister Simon Watts has repeatedly stressed, New Zealand’s main climate tool is now the emissions trading scheme (ETS). However, this now covers only 35% of net emissions and is not an effective way to reduce oil use.

At the current price of NZ$40 per tonne of carbon dioxide emissions, the ETS adds only nine cents per litre to the price of petrol. Given New Zealand’s high car dependency, this has virtually no effect on existing drivers or on car buyers.

How to cut oil use in transport

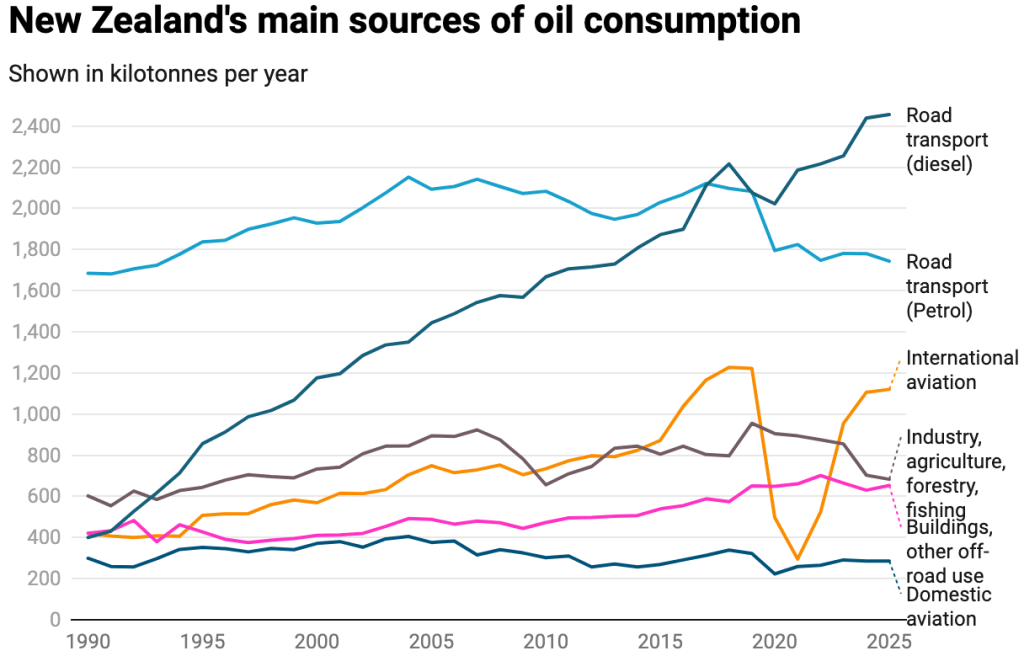
In New Zealand, 80% of oil goes into air and land transport. An oil transition plan really means a transport plan.

Source: MBIE Energy Quarterly

There is a known way to turn off the tap on oil. The “avoid, shift, improve” framework is supported by three decades of experience.

Changing work patterns such as shorter work weeks and working-from-home arrangements can help avoid unnecessary travel. Better infrastructure for walking and cycling and public transport helps to shift transport and dramatically reduce oil use.

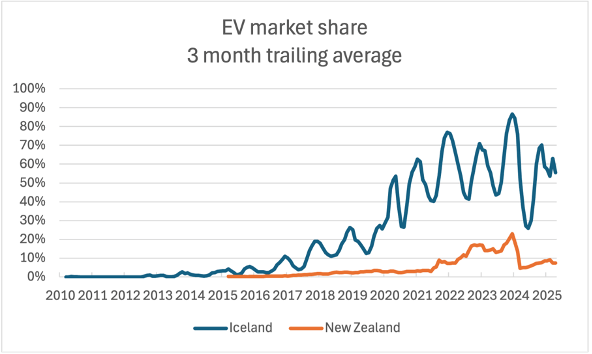
The remaining private vehicle travel can be improved through electrification. This requires a combination of incentives and stronger emissions standards, as the International Energy Agency reinforced this week.

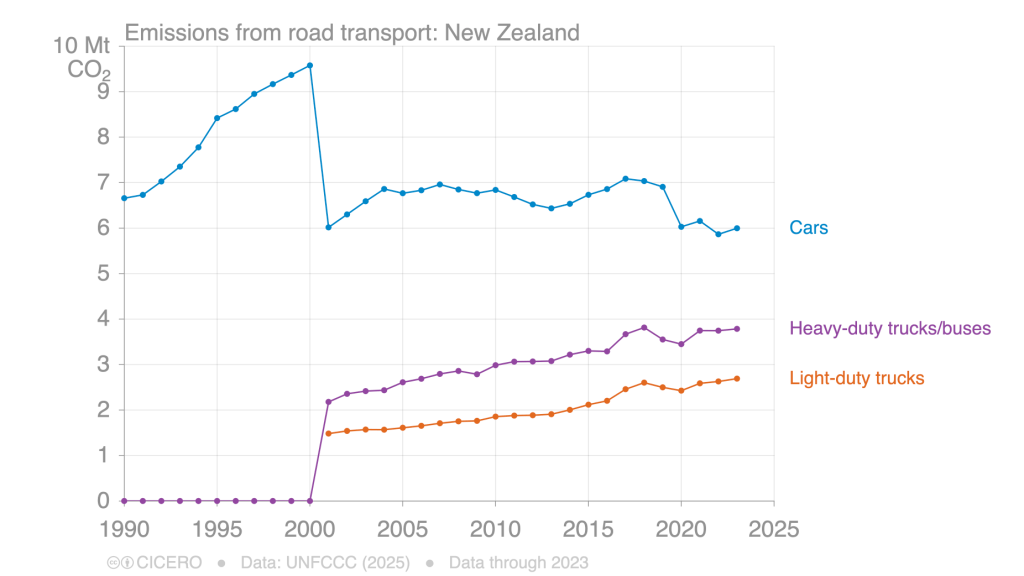
At present, New Zealand is still moving in the wrong direction. Over the past decade, the total distance driven by light vehicles increased by 20%, while the distance driven by utility vehicles is up 55%.

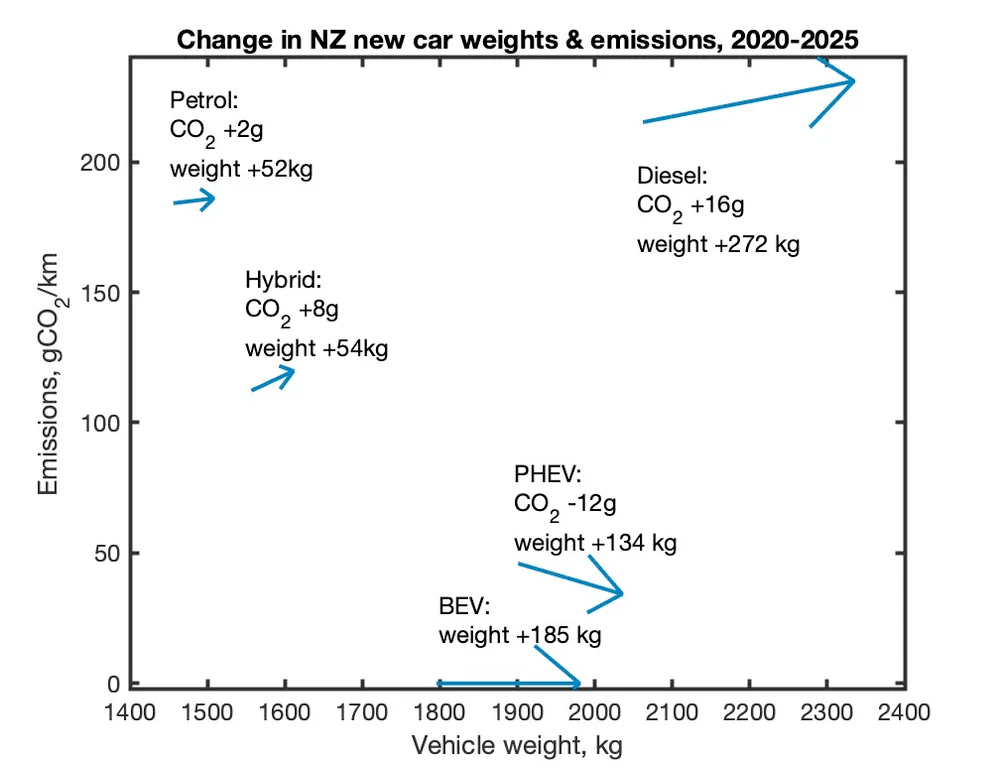
Each utility vehicle has 50% higher carbon emissions than a (fossil-fueled) passenger car. These trends have outweighed the improvements from the rise of hybrid and electric vehicles.

There is a limit to how quickly New Zealand’s fleet can realistically be electrified. For a country with the world’s highest rate of car ownership, mass purchasing of new cars is not a good transport solution by itself.

But in any event, phasing out fossil fuels is required for a safe future and should happen in ways that build energy resilience and independence.

This article is republished from The Conversation under a Creative Commons license. Read the original article.

We should have weaned off oil long ago

By Robert McLachlan

Yes, we should have weaned off oil long ago. The oil shocks of the 1970s would have been a good time to start. Failing that, the 2007 oil price spike that was one of the triggers of the Global Financial Crisis. Never mind. The third best time to start is now.

New Zealand’s oil consumption for road transport has nearly doubled since 1990. Preliminary data from MBIE suggests another 4% rise between 2023 and 2025.
Industry is doing it tough.

What are the drivers of this increase? More cars, obviously, but also more people, with each person driving further.

Here’s the breakdown over the past decade:

Impact on road transport CO2 emissions from change in…Change between 2013 & 2023
Population:+16.1%
Fuel economy of fossil-fueled car fleet:–15.6%
Distance driven in light vehicles, per person:+4.5%
Fleet shift from cars to utes:+4.5%
Proportion of electric driving–1.7%
Total change in CO2 emissions+4.2%

Utility vehicles emit 50% more than (non-hybrid) cars – 259 gCO2/km vs 175 gCO2/km – and the shift is at least partly cultural, with the twin-cab ute becoming a social norm. Utes now comprise 18% of the light vehicle fleet, do 23% of the kilometres, form 26% of sales, and emit 31% of light vehicle CO2. If that shift continues, as it appears to be doing, it forms a significant headwind to emissions reduction.

Lately, although the shift to hybrids is reducing emissions, fossil-fueled cars themselves are getting heavier and higher-emission.

What’s up with those diesel cars at 231 gCO2/km?! The average petrol hybrid at 121 gCO2/km does not even meet the 2026 fuel economy standard of 108 gCO2/km. Averaged over all sales, the target is being exceeded by 27 gCO2/km.

Overall, the picture is grim. On balance the country is no better prepared for an oil price or supply shock than we were in the 1970s – oil imports were 2.5% of GDP last year, compared to 1.8% in 1974. But in one respect, we do have an advantage. We know how we failed to seize the opportunity previously, and we know what will work this time.

As Tim Welch wrote last week,

New Zealand still has a choice, however. It already powers lights, hospitals and factories with renewable electricity. It could have powered a diverse transport system the same way, and it still can.

Every bus electrified, every cycleway built, every train funded is a direct reduction in exposure to the next crisis. The question now is whether New Zealanders begin to treat their car dependence not as a lifestyle choice but as a strategic liability.

Cars and trucks and things that have to go

By Robert McLachlan

Since 1978, diesel vehicles in New Zealand have paid road user charges (RUC) via a formula that depends on vehicle size and weight. Petrol vehicles currently pay a fuel tax instead of RUC. Electric vehicles (EVs) were granted an exemption from RUC in 2009 which expired on 1 April 2024. From that date, EV owners were required to pay RUC at the same rate as light diesel vehicles such as utes.

The government plans to shift all light vehicles onto RUC, possibly by 2027.

The current rate of fuel tax is 92 c/l. As one litre of petrol emits 2.31 kg of CO2 when burned, this is equivalent to a carbon charge of $398 per tonne of CO2. Petrol also incurs a carbon charge via the Emissions Trading Scheme (around $50/tCO2). Thus, removing fuel tax would reduce the carbon charge from $448 to $50 per tonne.

The effect would be that fuel costs of a small petrol hybrid would increase from 10c to 14c per kilometre, while that of a large car would fall from 25c to 23c. An EV would cost 11c per kilometre if charged at home on off-peak rates, or 23c per kilometre using public rapid chargers.

No country has tried this approach yet, although Iceland is planning to do so next year. Wisely, they will also double the carbon charge on petrol (from $100 to $200/tCO2) at the same time. They also retain other strong transport/climate policies. The purchase tax on a high-emitting car can be up to 65% of its value, and the government intends to ban the sale of fossil-fueled vehicles after 2030. In Iceland, 18% of the light vehicle fleet is already electric, compared to 3% in New Zealand.

(For more details, see my report “The emissions impact of a shift to universal road user charging in New Zealand“.)

But what about trucks?

Trucks are, of course, another large source of fossil fuel emissions that needs to be phased out. At present just 0.37% of the light commercial fleet is electric (mostly vans, not utes), while the figure for heavy vehicles is 0.46% (mostly buses, not trucks – although there are 194 electric heavy trucks in the country). Diesel trucks, utes, and vans are already exempt from fuel tax and pay RUC instead. Thus, they face a much lower effective carbon tax than cars, which could be a factor in their relatively slower improvement over time. (Diesel cars have actually been getting worse in recent years.)

However, they do get one big incentive – unlike cars, they are still exempt from RUC. The exemption ends on 1 January 2026. Perhaps this is a small change in the grand scheme of things. But it is one more change in the wrong direction, with an uncertain outcome – as far as I know, no analysis or investigation of any kind has been done on this. It is possible to design a scheme under which everyone contributes fairly according to their impact, and which still incentivizes change. At the start of this year, Denmark introduced RUC for trucks, under a formula which takes into account vehicle weight and CO2 emissions. (EV trucks get an 80% discount.) The effect has been phenomenal, with EV market share for trucks jumping straight up to 25%.

Emissions from cars are now back to 2001 levels, while trucks and utes are up 80% and still increasing. Prior to 2001 road transport emissions were not split by vehicle class. The decline in emissions from cars since 2018 is due more to behaviour change than cleaner vehicles – working from home, and less driving due to the recession.
Norway is seeing sustained reductions in emissions from cars, now that virtually all new cars sold are electric. Norway’s emissions from trucks are 1/3 less than New Zealand’s, but have yet to see significant reductions.
Lowly worm in his apple car.

New Zealanders’ energy use continues its 22-year decline

By Robert McLachlan

Every three months the Ministry of Business, Innovation and Employment puts out a useful document called the Energy Quarterly. It provides up-to-the-minute data on fossil fuel emissions, well in advance of the more detailed submissions for the UN which currently only run up to 2022. It’s where I get the data for graphs like this one:

My point is to make regular reminders that addressing climate change means phasing out fossil fuels and that we are only just starting on that task. But the details are important and interesting, too, such as the recent upswing in electricity emissions due to the record-low lake inflows. This serves as a reminder that the ‘dry year’ problem isn’t yet solved, and that without the significant new wind and geothermal plants that were completed in 2023 and 2024 we really would have had an energy crisis.

The electricity generation data in the Quarterly also shows that a long static period in New Zealand’s power generation is coming to an end. The biggest trigger for investment was the passage of the Climate Change Response (Zero Carbon) Amendment Act in 2019; projects that started construction in the following years are now operating.

However, future growth depends on anticipated future demand from climate action – phasing out fossil fuels and ‘electrifying everything’. The energy and transport sections of the final Second Emissions Reduction Plan do nothing to promote electrification, placing this recent growth at risk.

But what about the big picture on energy?

In addition to the Quarterly, MBIE produces an annual report, the latest being New Zealand Energy 2024. Here’s their summary:

The report includes many graphs, but not one showing what to me is the most striking development: total energy use has been falling for six years, and is now down nearly 10% from its peak in 2017.

Here ‘renewable’ energy is made up of hydropower (46%), geothermal (25%), biofuel (mostly wood – 23%), wind (6%), and solar (1%). Modern renewable electricity generation (wind, geothermal, and solar) was 41 PJ in 2023 or 6% of final energy demand. Here energy is what MBIE calls ‘final energy demand’, which includes the full energy content of fossil fuels and electricity but not the waste heat component of geothermal. The ‘substitution method’ used by Our World in Data (which upscales renewable energy to compensate for the thermal inefficiency of burning fossil fuels) is not used.

Coal, gas, oil, and even renewables are all down from their peaks. Looked at per capita, the effect is even more striking:

Energy use per person has been declining fairly steadily since 2001, and is now down 28% from peak. Is twenty-two years long enough to call it a trend?

There are probably many factors at play here that would be hard to untangle. At first sight the data doesn’t fit either of the convenient narratives on energy, ‘transition’, in which modern renewable energy gradually replaces fossil, or ‘more and more‘, in which new energy sources simply add to humanity’s rapacious demands.

Most likely a combination of factors – energy efficiency, deindustrialisation, and behaviour change – are at work. Initial indications are that all three of those effects were still in play in 2024, as energy-intensive industries shut down or scaled back. When we do get started on mass electrification and serious behaviour change, the energy decline will accelerate.

How significant is the global solar energy boom?

By Robert McLachlan

RenewEconomy is a well-established Australian website focusing on green energy. Last week, they published an article by Andrew Blakers based around the claim that “New solar capacity is being installed faster than anything else in history.”

This received some push-back online (“disinformation!”), on the grounds that

(i) this is only electricity, not total energy; and

(ii) nature doesn’t care how fast something is installed, only about emissions.

We were directed to look at this graph from Our World in Data:

It’s true that solar forms a minute part (2%) of the energy supply as yet, and that emissions of no single fossil fuel has peaked, not even coal.

But the topic at hand is change, and for that we have to look a bit closer.

The low-emission transition is based on two main things:

(i) decarbonising electricity; and

(ii) switching all other energy uses to electricity (“electrify everything”).

You could add more items, such as using less energy in the first place, but that wouldn’t prevent the need for (i) and (ii).

Andrew Blakers is Emeritus Professor of Renewable Energy at the Australian National University, well-known for his work on 100% renewable energy futures and his contribution to the development of solar PV technology. I would be surprised if he had messed anything up.

On the surface the claim passes easily: 360 GW (gigawatts) of solar PV was installed in 2023 (the IEA says even more, 510 GW), and the fastest period of coal installation that I can find is 75 GW per year, in the mid 2000s.

But it’s more instructive to look at electricity generation, rather than just installed capacity. Solar has a particularly low capacity factor – it generates less when it’s cloudy, and not at all at night time. It’s also at risk of going unused when too much is generated at the same time.

To look at this I have carried out the following steps:

  1. I downloaded data on world electricity generation from ember.org.
  2. As generation fluctuates a lot from year to year, I smoothed the data to reveal the underlying trend.
  3. I computed the change in generation from each year to the next.

Steps 1 and 2 give the following results for the 6 main sources of electricity:

Solar is the smallest of the six, and the fossil sources are still growing.

Step 3 gives the following results for the growth rate of each source of electricity:

Coal’s rate of growth peaked at 300 TWh (terawatt-hours) per year in 2005 (the rise of China); it then declined until 2019 before accelerating again. Some of that is offset by a slowdown in gas. But still, the combined slowdown of coal and gas stopped in 2020, which is alarming.

Solar added nearly 300 TWh in 2023, more than any other source, and pretty much matching coal’s old record. Actually, the 2023 data from Ember is provisional – if the IEA’s estimate is correct, the increase could be 400 TWh.

My conclusion is that the original headline (“solar is being installed faster than any technology history”) may be a bit breathless and lacking context, but the underlying trend is clear, and the record is significant. 2023 really was off the charts, and more is yet to come. Solar power generation is increasing as fast as any kind of electricity has ever done. This has been done despite many regions placing no restrictions on fossil fuels at all, and the global average carbon price being just US$5/tonne.

Imagine what we could do if we really tried.

Climate and the Government’s transport plan

by Robert McLachlan

[This is my personal submission to the Draft Government Policy Statement on land transport. Submissions close at noon on Tuesday 2 April, 2024.]

In the Emissions Reduction Plan (ERP1), transport emissions fall 41% by 2035. As the Ministry of Transport says, “Achieving this will reduce our dependence on fossil fuels and give us a more sustainable, inclusive, safe and accessible transport system that better supports economic activity and community life.” There is plenty of detail in the plan:

The plan is supported by four specific transport targets:

Target 1 – Reduce total kilometres travelled by the light fleet by 20 per cent by 2035 through improved urban form and providing better travel options, particularly in our largest cities. 

Target 2 – Increase zero-emissions vehicles to 30 per cent of the light fleet by 2035. 

Target 3 – Reduce emissions from freight transport by 35 per cent by 2035. 

Target 4 – Reduce the emissions intensity of transport fuel by 10 per cent by 2035. 

Targets 1 and 3 are wrecked by the Draft GPS, while Target 4 is already suspended. Target 2 is also threatened by related government actions to slow the uptake of EVs and other low-emission vehicles: cancelling the CCD, imposing high RUCs on EVs (a world first), proposing to weaken the CCS, and proposing to replace fuel tax by RUCs based on distance and weight.[1] The Ministry advise that the first two of these alone may limit EV share of the light vehicle fleet to  7% by 2030 (and 23% market share)[2], vs. 12.5% in the Climate Change Commission’s Demonstration Path (and 64% market share), putting the 2035 target at risk. However, the Ministry’s model involves 22,000 EV sales in 2024. In fact there were only about 1,700 sales in the first quarter.

The ERP1 for transport is not rocket science and should not be at all controversial. Internationally, all transport climate plans include the basic elements of fuel standards, mode shift, public transport planning. The IPCC in their summary of evidence say the same thing. The debate is over the mixture of fees, incentives, regulations, and bans, not over the direction of travel. The Draft GPS would wreck this plan. Spending on walking, cycling, and public transport would reduce and become highly constrained. Spending on rail infrastructure would reduce drastically, which could render the national rail network non-viable. That in turn wrecks the New Zealand Rail Plan, intended to increase the proportion of heavy freight carried by rail by building high-tech truck/rail freight hubs and new rail ferries.

Dropping climate from the GPS drops it from NZTA, currently the lead agency charged with delivering emissions reductions from transport. What could replace it? The government is committed to meeting the emissions budgets, but have not yet released much detail about how they plan to do that, other than that the ETS will be the main tool.

But it is well known that carbon charges are not an effective way to reduce transport emissions. At current prices the ETS adds 15 cents per litre to the price of petrol, or $15/1000 km. The RUC rate for light vehicles is $76/1000 km. The carbon price would have to increase by a factor of five just to match that, which is unthinkable – it would destroy all other exposed sectors.

This issue has been covered extremely thoroughly in the international literature. In 2022, I co-authored a review with David Hall on “Why emissions pricing can’t do it alone[3]. The Climate Change Commission identified ten types of barriers to a low-emission transition; tellingly, transport is the only sector for which they proposed specific fixes for all ten barriers. Nearly all of them are under attack.

So it is really flying in the face of evidence think that the ETS can be our main climate tool, particularly for transport. Details are lacking – Minister of Climate Change Simon Watts will only say that work on the second Emissions Reduction Plan (2026-2030) is under way. Analyst Christina Hood has repeatedly detailed how the ETS will struggle to deliver even under present conditions[4].

Emissions reductions first entered the GPS in 2015, under John Key. It was raised to a strategic priority in 2018 and 2021, but now it is proposed to be dropped. Presumably, all work streams in NZTA related to emissions reduction will be stopped and all work teams dissolved. So, despite all the other alarming and potentially disastrous parts of the Draft GPS, this one is the worst.

Section 5ZI(3) of the Climate Change Response Act 2002 states that

The Minister may, at any time, amend the plan and supporting policies and strategies to maintain their currency, (a) using the same process as required for preparing the plan; or (b)in the case of a minor or technical change, without repeating the process used for preparing the plan.

But the Draft GPS states, in contrast, that

Following the general election and a change of government in late 2023, the intended emissions reduction policies foreshadowed by the previous Government are being reassessed. For this reason, GPS 2024 has not undertaken the alignment exercise as anticipated in ERP1. The Emissions Trading Scheme (ETS) is the Government’s key tool to reduce emissions. In addition to the ETS, matters relating to climate change/emissions reduction issues are being worked through and will be addressed during development of the second Emissions Reduction Plan (ERP2). 

Thus both the Draft GPS and the decision to not perform the alignment exercise are in violation of the Climate Change Response Act 2002. Note that the relevant “plan” referred to in section 5ZI(3) in this case is ERP1, not ERP2. In addition, many of the activities needed to support the 2nd and 3rd carbon budgets need to be undertaken in the first budget period.

Slower transport emissions reductions from existing policies mean that other policies will need to be developed to replace them. I am skeptical that the two that have been announced – higher carbon prices and faster EV charger rollout – can make up the difference. But at the very least the modelling and policy advice to support this approach should be published. To put it another way, the climate plan and the transport plan should be prepared together. But they have not been prepared together in what appears to be a deliberate strategy.

Another possibility is transport emissions will be allowed to decrease more slowly that previously intended and that other sectors will make up the difference. But transport is so large a share of emissions that it is hard to know where the other savings could come from. Three other large sectors are agriculture, industry, and trees. The first two may struggle to deliver greater cuts, while trees are already performing a far greater share of net emissions reductions than in any other developed country and are also facing policy challenges and risk transferring climate obligations to future budget periods. 

To sum up, the Draft GPS constitutes climate denial.

Recommendations

R1.          Perform the alignment exercise required of the GPS by ERP1.

R2.          As the proposed changes to ERP1 are neither minor nor technical in nature, but strike directly at its heart, revise ERP1 using the process required by the Climate Change Response Act.

R3.          Publish the legal advice received regarding R1 and R2 above.

R4.          Reinstate emissions reduction as a strategic priority of the GPS.


[1] https://www.thepost.co.nz/nz-news/350179050/casualties-governments-declaration-war-evs

[2] Departmental Report to the Transport and Infrastructure Committee, RUC Amendment Bill, https://www.parliament.nz/resource/en-NZ/54SCTIN_ADV_60f18385-f31e-4c3e-1dba-08dc38a90c66_TIN1082/e69f6e2b63ae81e98f300a8d3cc146de8b21ae76

[3] https://ojs.victoria.ac.nz/pq/article/view/7496

[4] https://www.linkedin.com/pulse/nz-ets-review-zero-carbon-act-theory-vs-reality-christina-hood/?trackingId=DtF8IukNSzW5egD9Mc2POg%3D%3D

Aotearoa’s fossil fuel emissions, 2023

Three years ago I asked, “Why did New Zealand’s CO2 emissions blow out so spectacularly in 2019?“. At that point, emissions had risen 10% in three years. My conclusion was that

the forces for increasing fossil fuel burning were vastly more powerful than the puny forces opposing them. All the talk about climate change in 2017–2019 had little effect on the behaviour of companies or individuals.

Have we turned the corner? Possibly. The pro-fossil fuel forces are still there, but the opposing forces are gathering strength, especially through the Zero Carbon Act which for the first time includes a falling cap on emissions. In the most sensitive sector, electricity, the changes can be seen already. My takeaway from the new 2019 data is that the big four, road transport, aviation, electricity, and food processing, that are so large, that have performed so poorly, and that have so much scope for transformation, are where we need to look for change.

We don’t have full emissions data yet for 2023, but MBIE have just released a partial snapshot covering emissions from the burning of fossil fuels, which contribute 85% of gross CO2 emissions. 2023 was the first full post-lockdown year – travel restrictions were only eased in early and mid-2022.

Although emissions are up slightly, they are still well below the blow-out year of 2019, and stand at 23-year lows. 2022 and 2023 comprise the first half of the first 2022-2025 carbon budget, so low emissions in these two years will definitely help us meet the budget.

But digging into things in more detail, progress is not so great. Here’s the breakdown by fuel.

This shows that the fall in emissions in 2022-23 was due to falling electricity emissions, caused by full hydro lakes (hydro generation up 4200 GWh on the previous two years, or 5% of total generation) and new wind farms (up 1100 GWh). Solar (up 290 GWh) also started to make an appearance. That doesn’t mean that electricity emissions will bounce back, though: another 2800 GWh of new renewable generation is planned for the next three years, so even in an ‘average’ rain year we should be alright.

Clearly a major culprit is oil. It’s a big chunk of these emissions (70%) and it’s hard to move. Oil consumption is down on record highs, but not by much – closing the Marsden Point oil refinery in mid-2022 shifted 0.8 MtCO2 of emissions offshore, accounting for the whole decline.

The Clean Car Discount was introduced in mid-2021, and staying in place for 2 1/2 years, but has now ended. Road User Charges will be introduced on EVs in two weeks’ time, at a proposed rate of $76/1000 km – New Zealand will be the first country in the world to do this. (In Australia, the state of Victoria did impose RUCs on EVs, at A$25/1000 km, but this was annulled by the High Court last year.) There are also threats to weaken future fuel efficiency standards and to remove fuel excise duty entirely. Together these amount to a war on EVs which may lead to significant upward pressure on emissions. The fact that all the EVs in New Zealand are only saving 0.14 MtCO2 a year at present – too small to even see on the above graph – doesn’t mean they’re a failure, it just shows the scale of the problem and the persistence that is required.

Of course EVs are not the only or even the most important solution to transport emissions. In 2021 I wrote that “big battles over mode shift lie ahead” and these have now come to pass with the release of the Government’s draft policy statement on transport, which drastically de-emphasises cycling, passenger rail, and public transport. Climate Liberation Aotearoa have a handy mantra:

The first three are part of the first Emissions Reduction Plan, but the Government appears to think it is free to ignore the plan. As I read it, they are in violation of the Zero Carbon Act, which says that

The Minister may, at any time, amend the plan and supporting policies and strategies to maintain their currency (a) using the same process as required for preparing the plan; or (b) in the case of a minor or technical change, without repeating the process used for preparing the plan.

I guess that’s why we have lawyers.