New Zealanders’ energy use continues its 22-year decline

By Robert McLachlan

Every three months the Ministry of Business, Innovation and Employment puts out a useful document called the Energy Quarterly. It provides up-to-the-minute data on fossil fuel emissions, well in advance of the more detailed submissions for the UN which currently only run up to 2022. It’s where I get the data for graphs like this one:

My point is to make regular reminders that addressing climate change means phasing out fossil fuels and that we are only just starting on that task. But the details are important and interesting, too, such as the recent upswing in electricity emissions due to the record-low lake inflows. This serves as a reminder that the ‘dry year’ problem isn’t yet solved, and that without the significant new wind and geothermal plants that were completed in 2023 and 2024 we really would have had an energy crisis.

The electricity generation data in the Quarterly also shows that a long static period in New Zealand’s power generation is coming to an end. The biggest trigger for investment was the passage of the Climate Change Response (Zero Carbon) Amendment Act in 2019; projects that started construction in the following years are now operating.

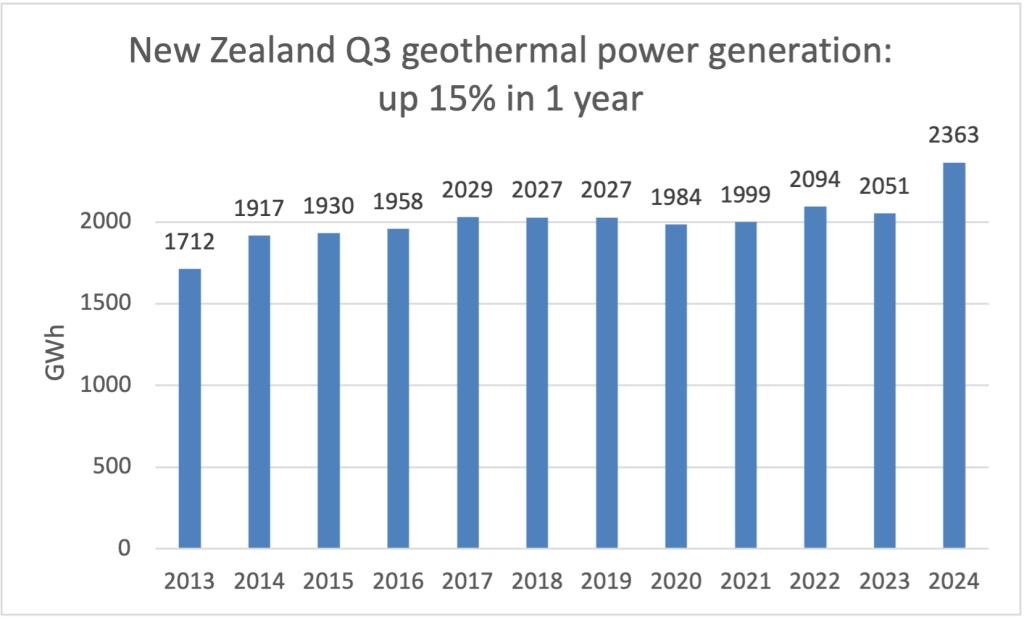
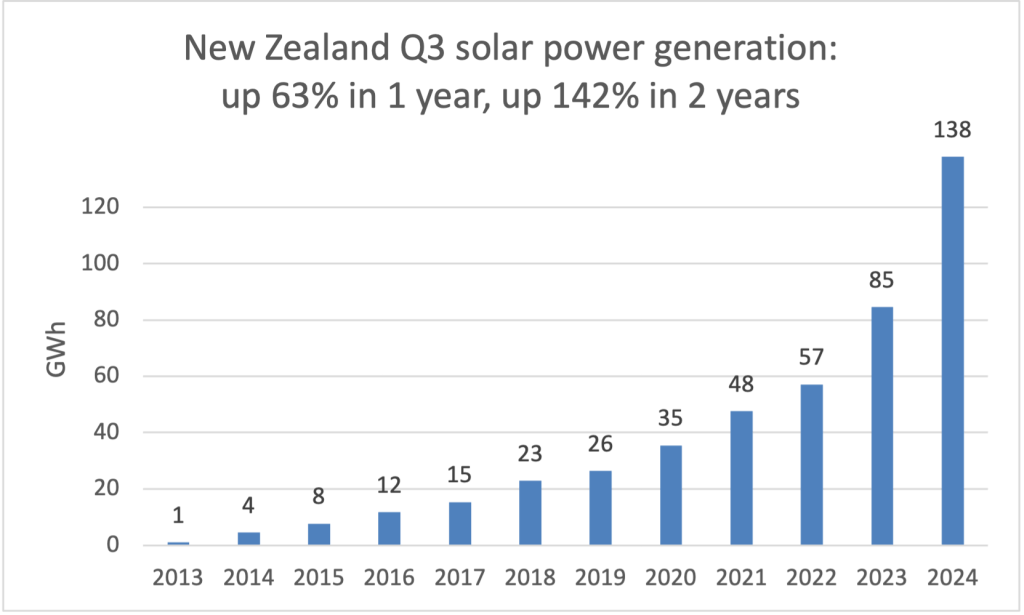
However, future growth depends on anticipated future demand from climate action – phasing out fossil fuels and ‘electrifying everything’. The energy and transport sections of the final Second Emissions Reduction Plan do nothing to promote electrification, placing this recent growth at risk.

But what about the big picture on energy?

In addition to the Quarterly, MBIE produces an annual report, the latest being New Zealand Energy 2024. Here’s their summary:

The report includes many graphs, but not one showing what to me is the most striking development: total energy use has been falling for six years, and is now down nearly 10% from its peak in 2017.

Here ‘renewable’ energy is made up of hydropower (46%), geothermal (25%), biofuel (mostly wood – 23%), wind (6%), and solar (1%). Modern renewable electricity generation (wind, geothermal, and solar) was 41 PJ in 2023 or 6% of final energy demand. Here energy is what MBIE calls ‘final energy demand’, which includes the full energy content of fossil fuels and electricity but not the waste heat component of geothermal. The ‘substitution method’ used by Our World in Data (which upscales renewable energy to compensate for the thermal inefficiency of burning fossil fuels) is not used.

Coal, gas, oil, and even renewables are all down from their peaks. Looked at per capita, the effect is even more striking:

Energy use per person has been declining fairly steadily since 2001, and is now down 28% from peak. Is twenty-two years long enough to call it a trend?

There are probably many factors at play here that would be hard to untangle. At first sight the data doesn’t fit either of the convenient narratives on energy, ‘transition’, in which modern renewable energy gradually replaces fossil, or ‘more and more‘, in which new energy sources simply add to humanity’s rapacious demands.

Most likely a combination of factors – energy efficiency, deindustrialisation, and behaviour change – are at work. Initial indications are that all three of those effects were still in play in 2024, as energy-intensive industries shut down or scaled back. When we do get started on mass electrification and serious behaviour change, the energy decline will accelerate.

How significant is the global solar energy boom?

By Robert McLachlan

RenewEconomy is a well-established Australian website focusing on green energy. Last week, they published an article by Andrew Blakers based around the claim that “New solar capacity is being installed faster than anything else in history.”

This received some push-back online (“disinformation!”), on the grounds that

(i) this is only electricity, not total energy; and

(ii) nature doesn’t care how fast something is installed, only about emissions.

We were directed to look at this graph from Our World in Data:

It’s true that solar forms a minute part (2%) of the energy supply as yet, and that emissions of no single fossil fuel has peaked, not even coal.

But the topic at hand is change, and for that we have to look a bit closer.

The low-emission transition is based on two main things:

(i) decarbonising electricity; and

(ii) switching all other energy uses to electricity (“electrify everything”).

You could add more items, such as using less energy in the first place, but that wouldn’t prevent the need for (i) and (ii).

Andrew Blakers is Emeritus Professor of Renewable Energy at the Australian National University, well-known for his work on 100% renewable energy futures and his contribution to the development of solar PV technology. I would be surprised if he had messed anything up.

On the surface the claim passes easily: 360 GW (gigawatts) of solar PV was installed in 2023 (the IEA says even more, 510 GW), and the fastest period of coal installation that I can find is 75 GW per year, in the mid 2000s.

But it’s more instructive to look at electricity generation, rather than just installed capacity. Solar has a particularly low capacity factor – it generates less when it’s cloudy, and not at all at night time. It’s also at risk of going unused when too much is generated at the same time.

To look at this I have carried out the following steps:

  1. I downloaded data on world electricity generation from ember.org.
  2. As generation fluctuates a lot from year to year, I smoothed the data to reveal the underlying trend.
  3. I computed the change in generation from each year to the next.

Steps 1 and 2 give the following results for the 6 main sources of electricity:

Solar is the smallest of the six, and the fossil sources are still growing.

Step 3 gives the following results for the growth rate of each source of electricity:

Coal’s rate of growth peaked at 300 TWh (terawatt-hours) per year in 2005 (the rise of China); it then declined until 2019 before accelerating again. Some of that is offset by a slowdown in gas. But still, the combined slowdown of coal and gas stopped in 2020, which is alarming.

Solar added nearly 300 TWh in 2023, more than any other source, and pretty much matching coal’s old record. Actually, the 2023 data from Ember is provisional – if the IEA’s estimate is correct, the increase could be 400 TWh.

My conclusion is that the original headline (“solar is being installed faster than any technology history”) may be a bit breathless and lacking context, but the underlying trend is clear, and the record is significant. 2023 really was off the charts, and more is yet to come. Solar power generation is increasing as fast as any kind of electricity has ever done. This has been done despite many regions placing no restrictions on fossil fuels at all, and the global average carbon price being just US$5/tonne.

Imagine what we could do if we really tried.