Robert McLachlan
Fifty years ago, in the early 1970s, the environmental movement was in its first heyday. Pesticides, herbicides, and air and water pollution were on the front page every day. One of the key debates from that time was the question of what was the true underlying cause of the environmental crisis – what today we would call the global ecological crisis.
In one camp, Paul and Anne Ehrlich pointed to overpopulation and overconsumption. Their influence reached as far as Elmwood Normal School, Christchurch, where as a little boy I did a project called “People Pollution”. In the other camp, Barry Commoner completely rejected their arguments and blamed modern technology almost entirely. His argument was based around the extreme suddenness with which pollution had grown.


Fast forward fifty years and this question, is the root cause overconsumption or is it bad technology?, is still with us today. In reality it’s a bit of both (and they affect each other), but that’s not a very satisfactory answer.
I’m going to look at this in the context of New Zealand, and, in a twist, instead of looking at what our choices are in the near future, I’m going to look backwards over the past thirty years. What were our realistic options, and what did we choose? The past has one big advantage over the future: we know what technologies were actually available at the time and how they evolved. What if we had chosen different technologies starting in 1990?
Would it have been possible to have an economy broadly like ours, but with much less impact on the environment?
To make things simple I’ll just look at CO2 from fossil fuels. (It would be an interesting exercise to repeat this thought experiment for other environmental impacts.)
There is little suspense here because we know we have not been a great performer:
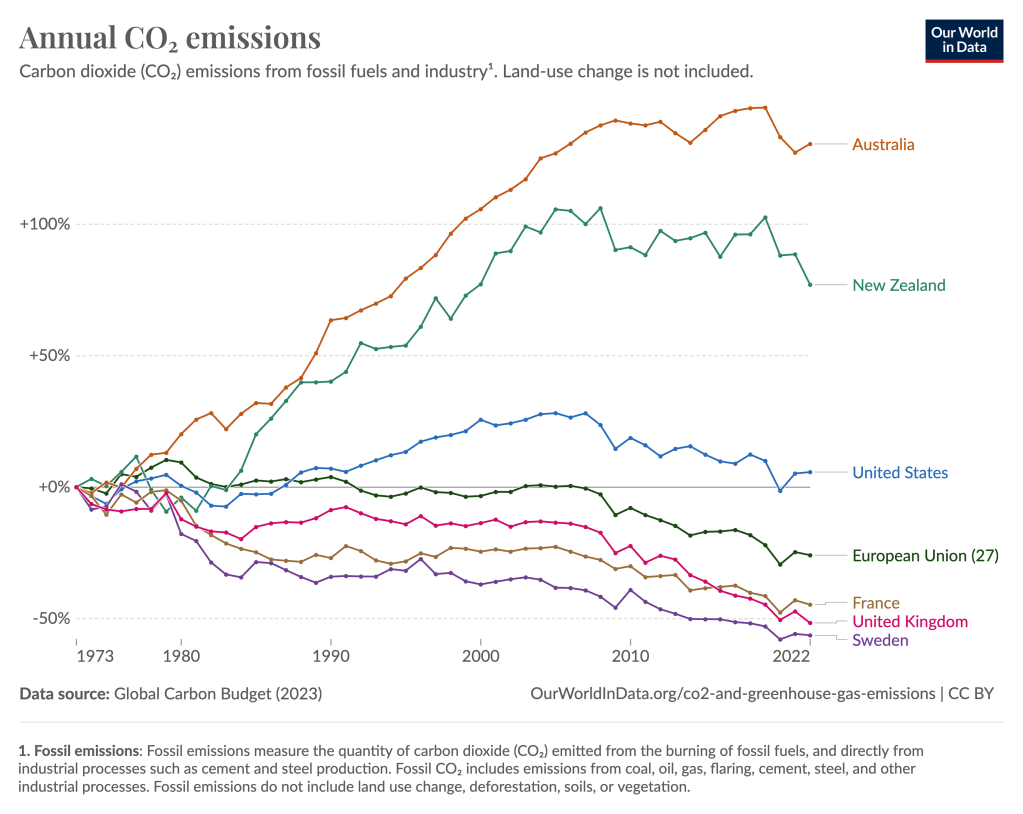
I’ve started this graph in 1973, the date of the first oil crisis. Higher prices put a lid on consumption for a while and spurred attention on efficiency. France turned towards nuclear power, Sweden towards biomass, first for district heating and then for liquid fuel. The UK started getting out of coal and into natural gas. In New Zealand, the Maui gas field had been discovered in 1969, at that time the eighth-largest gas field in the world, prompting extensive negotiations as to what to do with it. After a detour into self-sufficiency in liquid fuels (the world-first synthetic petrol plant at Motonui), ultimately the gas was used for new energy-intensive industries such as drying milk, and for electricity; much of it was exported in the form of methanol.
Since 1990 the New Zealand population and its economy have grown more rapidly than those of the EU or the US. The population of NZ has grown 60%, as has real GDP per capita. Both of those things tend to increase emissions, other things being equal. The economy is two-and-a-half times the size it was in 1990.
Meanwhile, fossil fuel burning has grown by 5.5 Mt or 25%. So, some relative decoupling, but still not great.
Let’s look at the main sectors.
Electricity
Electricity emissions rose from 4 MtCO2 to 10 Mt in 2005 (all that gas!) and then fell to 2-4 Mt. They could have been nearly zero by now. We could have built geothermal 20 years (even 50 years) earlier than we did. Wairakei (1958) was the first large-scale geothermal plant in the world; we were world leaders. (My first science job was a geothermal modelling project with the DSIR, in 1983.)
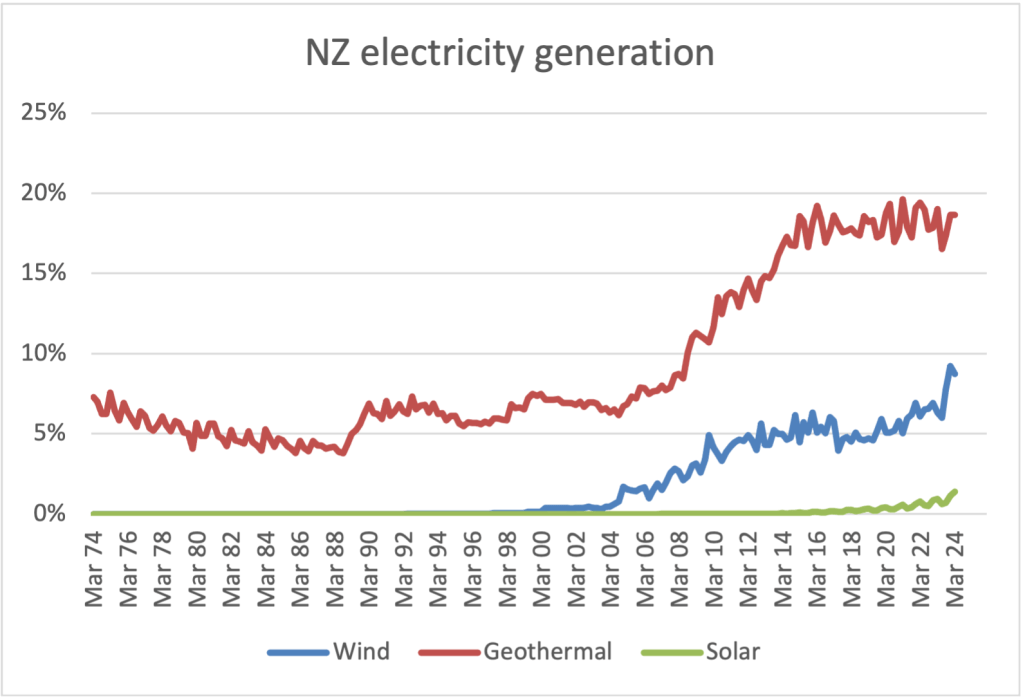
Then we could have built wind 10 years earlier, and kept at it instead of stopping and starting; and when Australia showed the way with solar we could have followed them, again 10 years earlier. Notice how both geothermal and wind show decade-long lulls in which entire nationwide industries stall due to insufficient focus on the environment. Just now, all three technologies are expanding again, but maintaining this long-term requires a determination to decarbonize the whole economy.

Industry
Industrial emissions have gone from 7 to 8 Mt, mainly due to the dairy industry. They had other choices, which they are only just getting around to installing now. (We did ‘save’ 1 Mt by closing the Marsden Point oil refinery, shifting the emissions to Singapore.) Likewise, instead of sending our scrap iron to Japan for 30 years, we could have recycled it here using electricity, as (thanks to the previous Government) we are finally getting around to. I’ll say we could be at 5 Mt now without much change to the economy.
Buildings
Emissions from buildings are up from 3 to 4 Mt – they could easily gone down if we had gone harder for energy efficiency and built up instead of out. What and where to build, and what to do with the existing stock of buildings, are still up for debate. These are contentious issues, so I’ll say the best we could have done is 3 Mt – but at least we would be well on the way to zeroing out this sector.
Transport
Oh yes, transport. This is the real culprit. Up from 8 Mt to 13.5 Mt, essentially the entire increase in our emissions. New Zealand had a car-dominated transport system in 1990. It still does today, only even more so. Could we have done better?
To be fair, transport is a difficult sector, one that all countries struggle with. But our choices have been worse than most. We could have imposed fuel efficiency standards in 1978, like the US, or in 2009, like the EU. (We did try in 2009, but the scheme was cancelled due to a change in Government – the cabinet paper makes for sad reading today.) Instead this was not introduced until 2023, and is about to be revised. We don’t even have a gas-guzzler tax like the US and Australia.
In New Zealand, transport emissions per person rose from 2.6 to 3.2 tonnes. In the UK, they fell from 2.0 to 1.8 tonnes. Since we had more scope for improvement in both efficiency and mode share, I’m going to say we could now be at 2.2 tonnes. We would still have a largely car-based transport system, just not quite so much. That would put our present total transport emissions at 9 Mt.
Adding it all up, CO2 emissions could have gone from 22 to 17 Mt using only technologies that were already in existence and proven in other countries. Even better, we would then be well on the way to ending the use of fossil fuels altogether.

As I argued with Prof Dave Frame, I know a climate denier when I see one, and National is a gaggle of climate deniers. It’ll be interesting to see if the panel on methane adopts his position, viz: we don’t expect other emitters to lower the temperature increase they caused so why should be expect farmers to do so. (NZ pledged to reduce GHG emissions – can we ignore that?)
We expect a change of government here in the UK next week so the attitude of decarbonistation might change. Having said that my daughter has just bought (on my advice) a mild-hybrid Volvo estate for family use, but ultimately will get a small EV for local use. Not too bad a compromise as both parents walk to the hospital unless on nights or “on call”.
Unfortunately in NZ it will be hard to change the mindset that people can live and work miles apart and expect petrol to be cheap. When the Thames-Whitianga road collapsed people were complaining they had to drive hours on alternative routes to get to work. It’s a madness that won’t change. (I have never driven a car to work in my life.)
Robert do you have a graph for consumption rather than generation for NZ electricity? I am sure it looks very different. and graph 2 if you are going to use that ‘Our world in data’ you should look at the “substitution method” they note in caption it exaggerates by 2.5 times the renewables by assuming efficiency factor is the same as fossil fuels “Substituted primary energy, which converts non-fossil electricity into their ‘input equivalents’: The amount of primary energy that would be needed if they had the same inefficiencies as fossil fuels. This ‘substitution method’ is adopted by the Energy Institute’s Statistical Review of World Energy, when all data is compared in exajoules.”
Sorry for the delay in replying. Electricity consumption in NZ has not grown since 2010, efficiency gains have been offset by population growth & transfer of fossil fuels to electricity has scarcely started yet.
I agree about the substitution method. In Graph 2, the y-axis values are not important, the graph is there is show that “exponential growth” hype does not always hold true in practice.