I was recently introduced to climate scientist James Dyke’s excellent newsletter, Eccentric Orbits, and the first article I read there opened with this:
This is our current moment: climate change by almost every single measure is getting worse while action on phasing out fossil fuels is slowing down or even stalling.
It’s true that climate change is getting worse – it will continue to get worse until emissions fall to near zero. But is action on phasing out fossil fuels really stalling?
There are certainly terrible developments in many places. But I want to point at that in some sectors in some countries, the phase-out of fossil fuels is definitely not stalling – it’s accelerating. Therefore, faster action is at least possible.
I decided to look at two sectors, coal and transport. They are both very large (being 40% and 20%, respectively, of global CO2 emissions, or 2 resp. 1 tonne of CO2 per person on average) but are very different.
To give an idea of the scale of the task, to phase out the burning of fossil fuels by 2050 means cutting emissions by about 0.2 tCO2 per person each year for the next 25 years. That is just the average value – cuts will have to be faster in the richer and higher-emitting countries.
Here are the 26 countries that have been phasing out coal the fastest over the past decade:
The average rate of decline for these countries was 0.18 tCO2 per year. Data: Our World in Data
For most of these countries, the phase out was twice as fast in 2018-2023 as in 2013-2018 – a dramatic acceleration. The 26 countries reduced coal emissions by an average of 0.18 tCO2/person every year for a decade.
EU emissions from coal fell another 13% in 2024 (not shown).
This was achieved through concerted policy and planning maintained over a long period.
Here are the five worse performers, for comparison:
Transport is very different to coal. The coal sector is dominated by a few large factories and most coal is used to generate electricity, where there are now cost-effective alternatives. Transport is highly dispersed and is shaped by social norms and by stupendous amounts of massive infrastructure – particularly so for cars. Transport emissions in many developed countries are dominated by private cars. The standard solution – travel less; walk, bicycle, and take public transport more; and electrify the remainder – all involve changes to people’s behaviour that can be contentious. (In France, when it was proposed to lower the speed limit on two-lane highways from 90 to 80 km/h, two-thirds of the speed cameras in the country were destroyed by protesters.)
New Zealand’s transport/climate policy is really only just getting started, and has undergone wild swings right out of the gate. So I was surprised to see that emissions from cars have not rebounded since Covid:
Source: UNFCCC + MBIE Energy Quarterly
The decline, about 15% (while population grew 7%), cannot be due solely to EVs or more efficient cars. Emissions of new cars are down by a quarter since 2019, but it takes time to turn over the fleet. The emissions of the average car on the road are only down 6%. So most of the decline must be due to something else. Driving less, due to working from home and the recession, are the two possibilities that come to mind. A surge in walking, biking, or public transport would have to be huge to make an effect of this size.
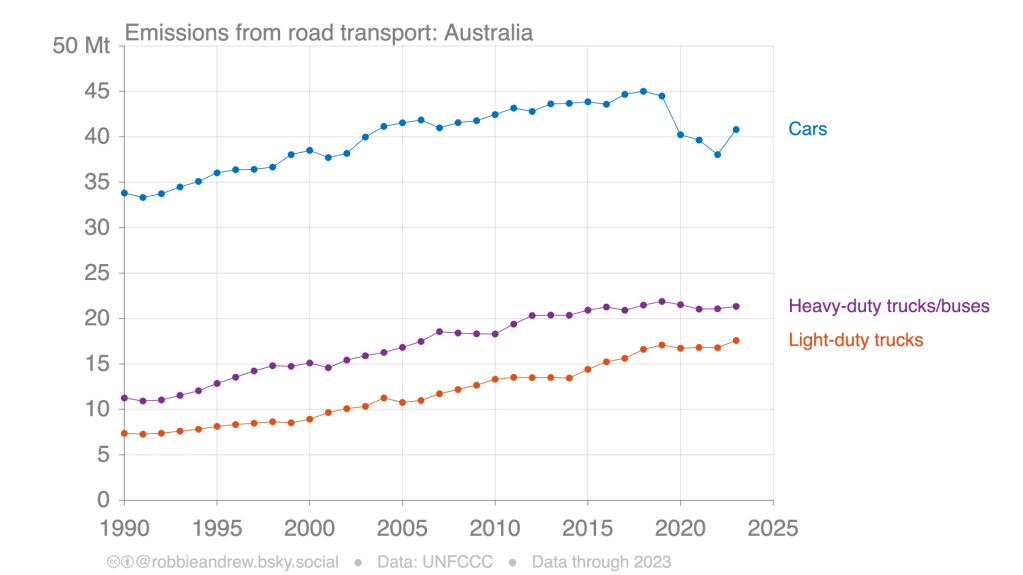
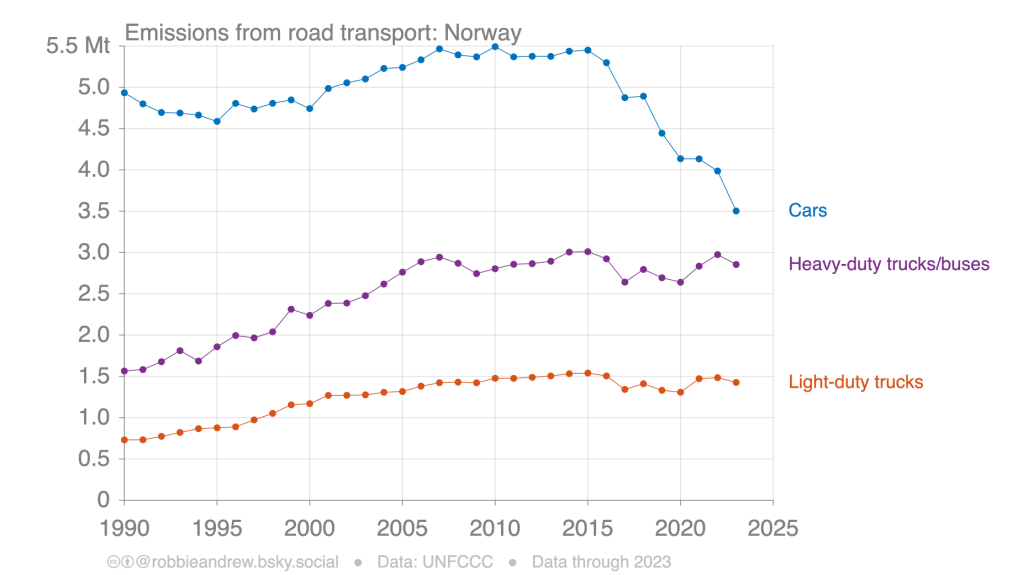
Even more surprising, the same thing appears to be happening in other countries too. New Zealander Robbie Andrew, who works at the Center for International Climate Research, Oslo, Norway, has kindly added road transport emissions data for the sixty-odd countries that he tracks. Many countries (but not all) have shown sustained falls in car emissions.
Of course, the standout example is Norway, where virtually all new cars are now electric. Norway will continue to see car emissions fall steadily to zero.
The surprise is that falls in other countries are almost as large as in Norway. New Zealand reduced from 1.44 to 1.16 tCO2 per person over 2018-2023, Norway from 0.92 to 0.63. The average reduction for the top 10 performers is 0.23 tCO2 per person (21%) over 5 years. That is outstanding for what is supposed to be a tough sector. What’s less clear is whether these reductions (if they are due to behaviour change) can persist and accelerate in the future.
Canada’s emissions are understated here as (like the US) they list most SUVs as light trucks. See below or examine the full data.
The same effect is seen for all road transport emissions (including trucks, utes, and vans). Now the picture includes an impressive result from Finland (split data not available) and even the United States. (Data for the US is for 2022 as they haven’t submitted their 2023 data to the UN yet… we can guess why.) Norway now shows only the 6th biggest drop, behind Austria, Canada, Finland, New Zealand.
Sweden’s progress may stall as part of it was due to a strong biofuel mandate which has now been scaled back after a change of government, lowering fuel prices and increasing emissions. Norwegians are even crossing the border to get some of that cheaper fuel.
There’s a limit to what can be concluded from this kind of broad overview. Every country has a different emissions profile and different climate politics. But my takeaway is that fast phase-outs of fossil fuels – 5-10% per year, sustained and even accelerating over several years – have been shown to be possible, even in large and diverse sectors and in different countries.
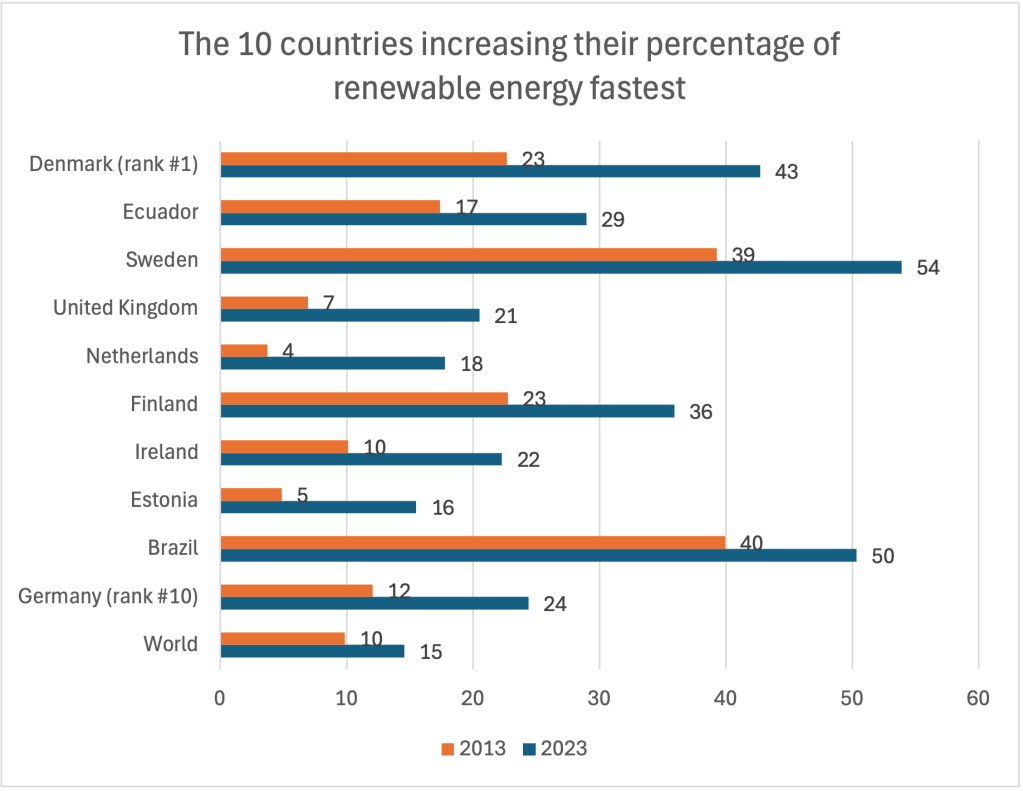
Postscript added 10 July. For another way to slice it, here are the 10 countries that have increased their percentage of renewable energy (all energy, not just electricity) the fastest, ranked by average performance over the past decade. Progress is accelerating – the average increase for 2013-2018 was 0.4 percentage points per year (top 10, 1.3%), for 2018-2023 0.6 percentage points per year (top 10, 1.8%). At that rate getting to 100% will take 150 years. The rate needs to triple (ie match the current best countries) for safety. Note that the top 10 countries are very different to each other. They are large and small, rich and poor, coming off a low or a high base. It’s easy to be discouraged looking at the scale of the task, but progress is possible.
The Nelson and Tasman communities have invested $32 million in a new airport terminal. It’s very smart, and made of wood, but it’s designed to increase fossil fuel emissions.
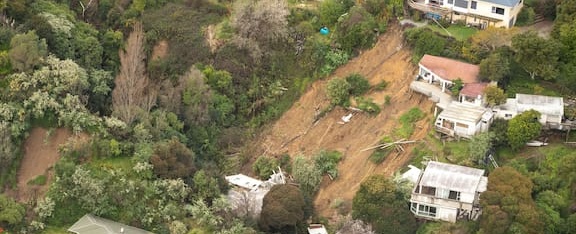
At the same time, Nelson has suffered repeated devastation from extreme storms, at a time when the city is looking to reduce emissions. The community’s critical asset – the airport – can be a helpful part of the city’s climate action plans.
Aviation is booming, especially in the Asia–Pacific region. Air travel has reached record numbers both domestically and internationally, with further strong growth forecast over coming decades.
Despite the financial headwinds faced by New Zealand’s regional airlines, operators say that “passenger numbers on regional airlines have never been better”. “Passenger numbers are through the roof”, says Sounds Air boss Andrew Crawford in a Newsroom article. Once again flights in and out of New Zealand are increasing, helped by the New Zealand government promoting international tourism as a key driver of economic growth.
To support the growth, international airlines are expanding capacity.
Airports across New Zealand have also set in place expansion plans. An example is Nelson. The airport wants to see passenger numbers double from 900,000 to 1.8 million a year by 2050.
Despite unambiguous evidence of the devastating impacts of human-induced climate change, commitments to decarbonise aviation are stalling both here and overseas. The result is that aviation emissions continue to increase at a time when other sectors are working hard to reduce theirs. In just-published research, Daniel Scott and Stefan Gössling examine the UN World Tourism Organization’s climate declarations and conclude that there has been limited to no progress on 25 climate action pledges. They also evaluate commitments by the World Travel and Tourism Council, IATA, International Civil Aviation Organization, and individual airlines, finding that none of their self-set targets has been met.
So how can aviation contribute to tackling climate change when no practicable technology-based solutions are on the horizon?
This problem of aviation emissions is playing out in Nelson, one of New Zealand’s premier tourist destinations. While it is known for its sunny days, in recent years it has also suffered from damaging storms that are predicted to become more frequent and intense with climate change. The August 2022 storm event caused more than $80m of damage in the region, and a downpour in recent weeks led to flooding in downtown Nelson. Recognising the need to reduce emissions, Nelson City Council will soon meet to approve its climate change strategy, aiming to reduce gross emissions by at least 6.8% each and every year, in line with the government’s target.
That will require significant new investment. Who should pay for it? Should it be the community as a whole, or should those who are causing the problem contribute more? If Nelson airport proposes to double passenger numbers without any realistic plan to reduce emissions, is there a way of adopting the “polluter pays” principle and using revenue from flying to help decarbonise other parts of the local economy?
There is a way. The airport is jointly owned by Nelson City Council and neighbouring Tasman District Council. It recently invested $32m in a new terminal (catering for future growth, which means growth in pollution), with further expansion on the drawing board. A “polluter pays” levy of $20 per departing passenger – about 10% of the average ticket price – would raise $9m per year towards climate action by the two councils. Potential uses of such a levy include funding active and public transport, helping businesses to reduce emissions via electrification, supporting community solar power, and funding adaptation infrastructure. Much greater price increases by Air New Zealand in recent years, of between 30% and 300% depending on the route, have had no impact on passenger numbers, indicating an ability and a willingness to pay. While most New Zealanders need to fly sometimes, most flying is done by a small number of frequent flyers. Globally, 1% of the world’s population, the wealthiest frequent flyers, are responsible for 50% of aviation emissions. Therefore, a “polluter pays” levy acts as a progressive, pro-climate tax.
It is true that New Zealand also has the Emissions Trading Scheme. Passengers contribute about $3 per domestic flight via the ETS. Unfortunately, this does little to nothing towards reducing emissions. At present the money either goes to the government (which has cancelled most direct climate spending) or towards the mass planting of pine trees, which is commonly criticised as being an ineffective strategy with negative effects on biodiversity.
Airports and airlines themselves should welcome such a levy, which could be introduced nationwide. They could then point to the tangible community benefits of the levy and maintain their social licence to operate in an era when the aviation industry’s bold claims (“Net zero by 2050!”) amount to so much greenwashing.
It needs to be recognised that such a levy only buys the aviation industry a little time, and that the industry needs to either rapidly decarbonise or start reducing flights to meet climate targets. At present it is impossible to know if any of their plans for lower-emission flights will come about or have much of an impact on emissions. We hope they do. But hope alone is not enough; hope needs action, and the time for action is now.
Since 1978, diesel vehicles in New Zealand have paid road user charges (RUC) via a formula that depends on vehicle size and weight. Petrol vehicles currently pay a fuel tax instead of RUC. Electric vehicles (EVs) were granted an exemption from RUC in 2009 which expired on 1 April 2024. From that date, EV owners were required to pay RUC at the same rate as light diesel vehicles such as utes.
The government plans to shift all light vehicles onto RUC, possibly by 2027.
The current rate of fuel tax is 92 c/l. As one litre of petrol emits 2.31 kg of CO2 when burned, this is equivalent to a carbon charge of $398 per tonne of CO2. Petrol also incurs a carbon charge via the Emissions Trading Scheme (around $50/tCO2). Thus, removing fuel tax would reduce the carbon charge from $448 to $50 per tonne.
The effect would be that fuel costs of a small petrol hybrid would increase from 10c to 14c per kilometre, while that of a large car would fall from 25c to 23c. An EV would cost 11c per kilometre if charged at home on off-peak rates, or 23c per kilometre using public rapid chargers.
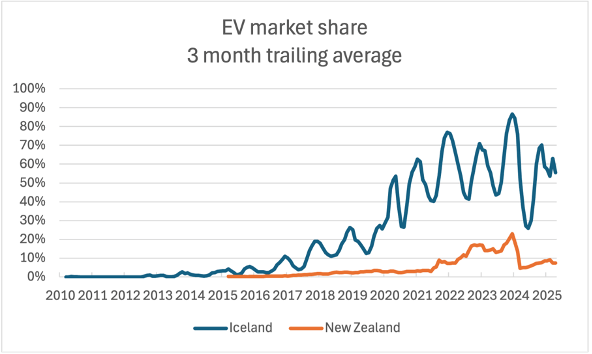
No country has tried this approach yet, although Iceland is planning to do so next year. Wisely, they will also double the carbon charge on petrol (from $100 to $200/tCO2) at the same time. They also retain other strong transport/climate policies. The purchase tax on a high-emitting car can be up to 65% of its value, and the government intends to ban the sale of fossil-fueled vehicles after 2030. In Iceland, 18% of the light vehicle fleet is already electric, compared to 3% in New Zealand.
Trucks are, of course, another large source of fossil fuel emissions that needs to be phased out. At present just 0.37% of the light commercial fleet is electric (mostly vans, not utes), while the figure for heavy vehicles is 0.46% (mostly buses, not trucks – although there are 194 electric heavy trucks in the country). Diesel trucks, utes, and vans are already exempt from fuel tax and pay RUC instead. Thus, they face a much lower effective carbon tax than cars, which could be a factor in their relatively slower improvement over time. (Diesel cars have actually been getting worse in recent years.)
However, they do get one big incentive – unlike cars, they are still exempt from RUC. The exemption ends on 1 January 2026. Perhaps this is a small change in the grand scheme of things. But it is one more change in the wrong direction, with an uncertain outcome – as far as I know, no analysis or investigation of any kind has been done on this. It is possible to design a scheme under which everyone contributes fairly according to their impact, and which still incentivizes change. At the start of this year, Denmark introduced RUC for trucks, under a formula which takes into account vehicle weight and CO2 emissions. (EV trucks get an 80% discount.) The effect has been phenomenal, with EV market share for trucks jumping straight up to 25%.
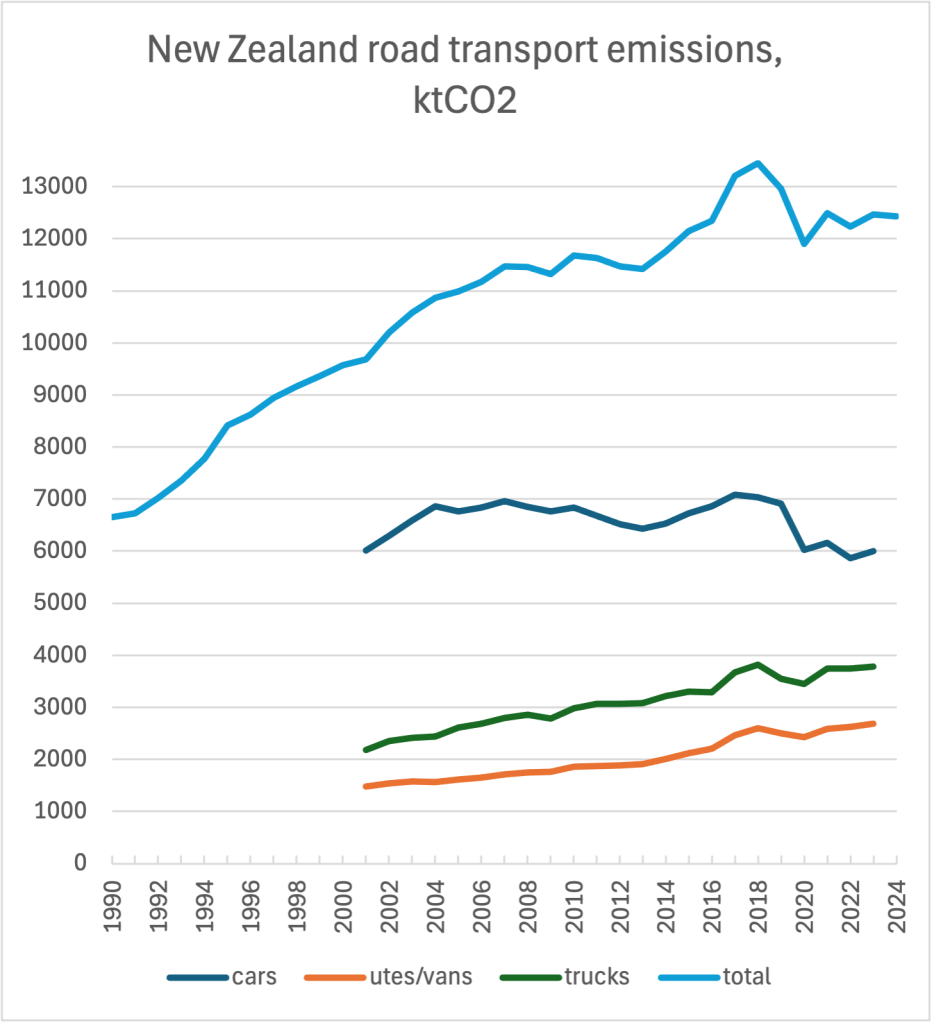
Emissions from cars are now back to 2001 levels, while trucks and utes are up 80% and still increasing. Prior to 2001 road transport emissions were not split by vehicle class. The decline in emissions from cars since 2018 is due more to behaviour change than cleaner vehicles – working from home, and less driving due to the recession.
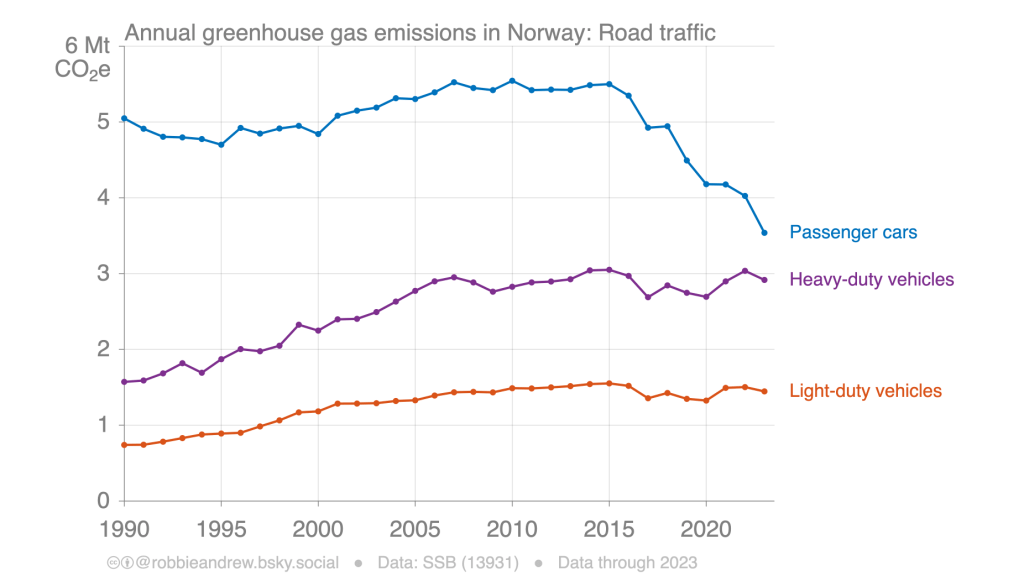
Norway is seeing sustained reductions in emissions from cars, now that virtually all new cars sold are electric. Norway’s emissions from trucks are 1/3 less than New Zealand’s, but have yet to see significant reductions.
The third iteration of Heart Aerospace’s proposed new aircraft, now a 30-seat parallel hybrid.
Back in 2021 electric aircraft were a hot topic. Paul Callister and I looked at three startups (Heart Aerospace’s ES-19, Eviation’s Alice, and the Lilium Jet) to see if their claims stacked up. They all faced serious difficulties with weight, range (especially the reserve range required for safety), and unproven technology.
Two of the three (Lilium and Eviation,the latter pre-ordered by Air New Zealand) went bankrupt in February 2025, leaving only Heart Aerospace. Their ES-19 (pre-ordered by Sounds Air) has undergone two radical redesigns. In May 2024, an innovative wing strut was added and the range was halved to 200 km, extended by a serial kerosene generator (ideally used only as a reserve). Later, the wing strut disappeared, and two of the four electric motors were replaced by standard kerosene turboprops – essentially a parallel hybrid. No test aircraft has yet been flown or even built, but commercial operation is still promised for 2030.
On the policy front progress has been no better. The Climate Change Commission has made a strong recommendation to bring international aviation and shipping into New Zealand’s 2050 climate target; the government has yet to respond, and the Commission has no brief to look at the issue further. The public/private partnership Sustainable Aviation Aotearoa, established in 2022 as part of the first Emissions Reduction Plan, has yet to issue reports, advice, or communications of any kind.
This was the background in my mind as I prepared to address the Royal Aeronautical Society’s New Zealand Division on “Tech hopes for the aviation industry” on 29 May.
Please watch the video of the talk below, or read the slides.
Every three months the Ministry of Business, Innovation and Employment puts out a useful document called the Energy Quarterly. It provides up-to-the-minute data on fossil fuel emissions, well in advance of the more detailed submissions for the UN which currently only run up to 2022. It’s where I get the data for graphs like this one:
My point is to make regular reminders that addressing climate change means phasing out fossil fuels and that we are only just starting on that task. But the details are important and interesting, too, such as the recent upswing in electricity emissions due to the record-low lake inflows. This serves as a reminder that the ‘dry year’ problem isn’t yet solved, and that without the significant new wind and geothermal plants that were completed in 2023 and 2024 we really would have had an energy crisis.
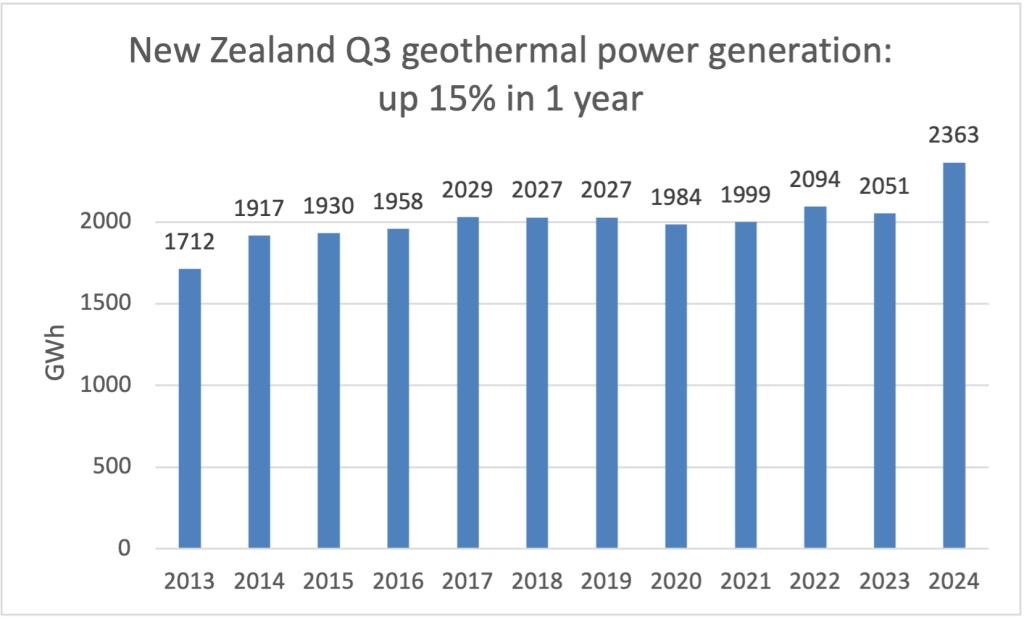
The electricity generation data in the Quarterly also shows that a long static period in New Zealand’s power generation is coming to an end. The biggest trigger for investment was the passage of the Climate Change Response (Zero Carbon) Amendment Act in 2019; projects that started construction in the following years are now operating.
However, future growth depends on anticipated future demand from climate action – phasing out fossil fuels and ‘electrifying everything’. The energy and transport sections of the final Second Emissions Reduction Plan do nothing to promote electrification, placing this recent growth at risk.
But what about the big picture on energy?
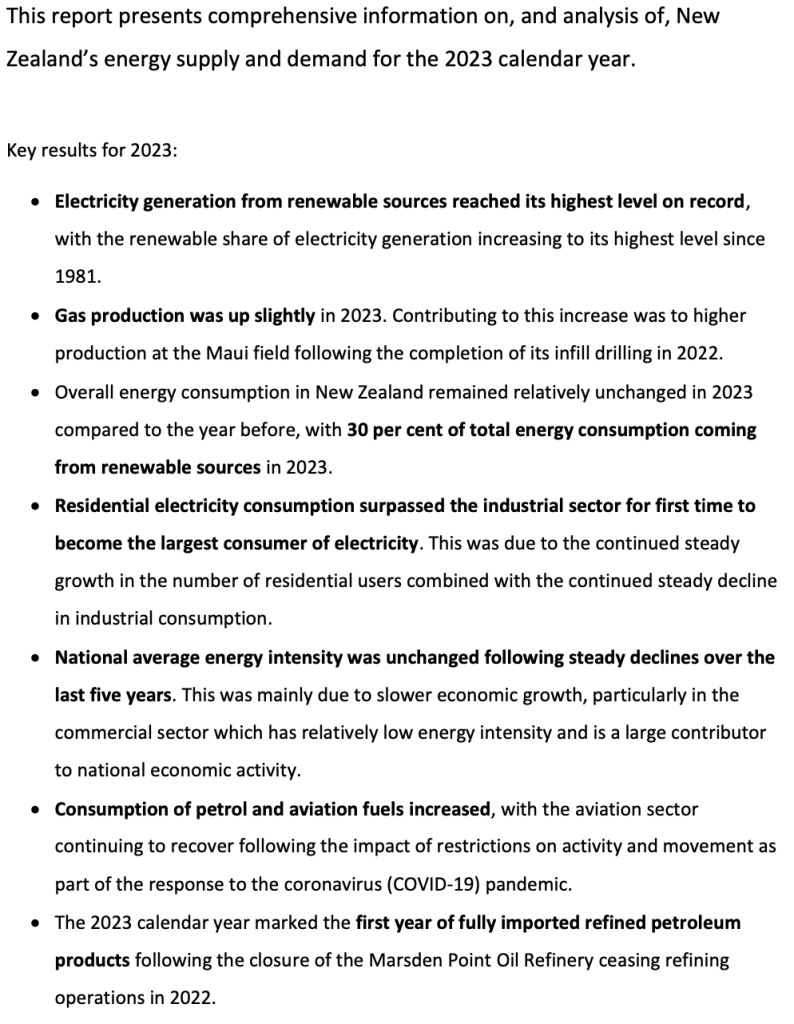
In addition to the Quarterly, MBIE produces an annual report, the latest being New Zealand Energy 2024. Here’s their summary:
The report includes many graphs, but not one showing what to me is the most striking development: total energy use has been falling for six years, and is now down nearly 10% from its peak in 2017.
Here ‘renewable’ energy is made up of hydropower (46%), geothermal (25%), biofuel (mostly wood – 23%), wind (6%), and solar (1%). Modern renewable electricity generation (wind, geothermal, and solar) was 41 PJ in 2023 or 6% of final energy demand. Here energy is what MBIE calls ‘final energy demand’, which includes the full energy content of fossil fuels and electricity but not the waste heat component of geothermal. The ‘substitution method’ used by Our World in Data (which upscales renewable energy to compensate for the thermal inefficiency of burning fossil fuels) is not used.
Coal, gas, oil, and even renewables are all down from their peaks. Looked at per capita, the effect is even more striking:
Energy use per person has been declining fairly steadily since 2001, and is now down 28% from peak. Is twenty-two years long enough to call it a trend?
There are probably many factors at play here that would be hard to untangle. At first sight the data doesn’t fit either of the convenient narratives on energy, ‘transition’, in which modern renewable energy gradually replaces fossil, or ‘more and more‘, in which new energy sources simply add to humanity’s rapacious demands.
Most likely a combination of factors – energy efficiency, deindustrialisation, and behaviour change – are at work. Initial indications are that all three of those effects were still in play in 2024, as energy-intensive industries shut down or scaled back. When we do get started on mass electrification and serious behaviour change, the energy decline will accelerate.
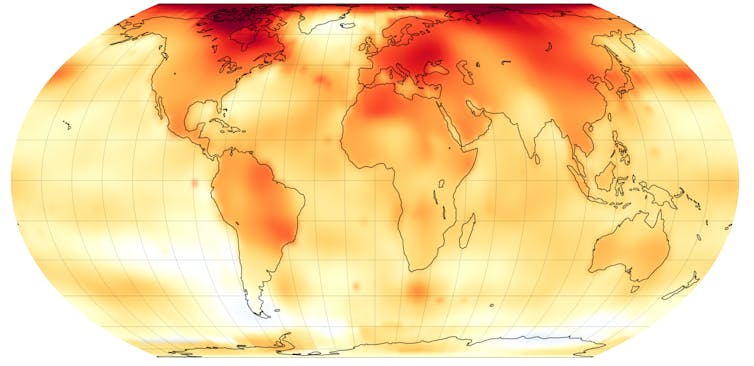
It’s now official. Last year was the warmest year on record globally and the first to exceed 1.5°C above pre-industrial levels. This doesn’t mean it’s too late to rein in further warming, but the ambition required rises with each delay in action.
New Zealand is no exception. Current climate policies are no longer a sufficient contribution to the global effort to keep warming at 1.5°C, according to the Climate Change Commission’s first review of the country’s 2050 climate target.
New Zealand’s current 2050 target has two components. Methane emissions from livestock must be cut by 24% to 47% below 2017 levels and emissions of all other greenhouse gases must reach net zero. But the commission has made three main recommendations to raise ambition:
a net negative target for emissions of long-lived gases (carbon dioxide and nitrous oxide) by removing 20 million tonnes more from the atmosphere than is released each year
a higher target range for biogenic methane emissions to reach at least 35% to 47% below 2017 levels
and the inclusion of emissions from international shipping and aviation.
The commission says these changes would bring New Zealand closer to “net zero for all gases”, in line with what is needed to achieve the goals of the Paris Agreement.
The 2050 target review was the last effort for the commission’s outgoing founding chair, Rod Carr, who has become a significant voice for climate action. In his closing words to parliament, he said:
Those who continue to promote the combustion of fossil fuels in the open air without permanent carbon capture and storage are, in my view, committing a crime against humanity.
The threshold for recommending a change is high. The commission must consider nine key areas and find “significant” developments that justify recommending a different target.
It found three significant changes occurred since the current target was set in 2019.
1. Global action is ahead of New Zealand
While other countries’ current policies, pledges or targets are not sufficient to keep temperature rise at 1.5°C, many countries now have more ambitious targets than New Zealand.
Australia, Japan, US, Canada, EU and Ireland all adopted full net-zero targets in 2021. Finland and Germany have or are considering net negative targets. Among countries with high biogenic methane emissions, several now have full net-zero targets.
2. Scientific understanding of climate change has changed
Climate impacts are appearing sooner and with more severity than the scientific community understood when the target was set in 2019.
3. The burden shifts to future generations
The increased risks and impacts of climate change have implications for inter-generational equity. Delaying action shifts costs and risks to future generations.
The commission’s report also explores New Zealand’s reliance on large-scale commercial exotic afforestation to meet its climate targets. This is one reason why Climate Action Tracker rates New Zealand’s response as highly insufficient and commensurate with a 4°C world.
Carbon in trees is part of the biosphere and will never be stored as permanently as fossil carbon. To take a case in point, Cyclone Gabrielle in 2023 (made worse by climate change) damaged forests, farms and infrastructure, and removed the social licence for forestry in the region.
How the recommended target was set
The commission’s work is tightly prescribed by law. It looked at four possible ways of sharing the global 1.5°C task: equal per capita emissions, national capacity, responsibility for historic warming and the right of all peoples to sustainable development.
New Zealand’s current target does not meet any of these standards, but the commission says the new target would at least meet the “national capacity” criterion and would be feasible and acceptable. However, it would still see New Zealand contributing two to three times its share of global warming this century.
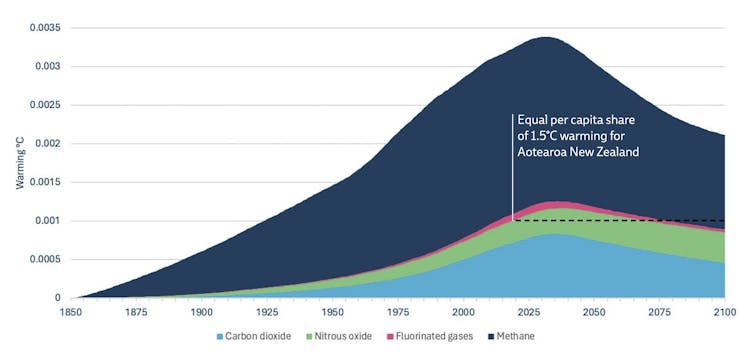
The commission’s assessment is independent of any global warming metrics such as GWP100 (currently the UN standard). Instead, the commission computed New Zealand’s historical and future contribution to temperature rise directly. Both commonly used historical baselines, 1850 and 1990, yield similar results.
New Zealand’s government is currently particularly at odds with the commission’s recommendation on biogenic methane. It appointed a separate advisory panel last year which put forward a target consistent with causing “no additional warming” to the planet from agricultural methane emissions.
This graph shows the contribution to warming from emissions in New Zealand (1850–2100) under the current 2050 target. Climate Change Commission, CC BY-SA
But the commission rejects this idea, finding that unless the rest of New Zealand’s target were to be strengthened significantly, this would not be consistent with the Paris Agreement or the country’s own climate law.
International aviation and shipping emissions
In a quirk of climate diplomacy, international aviation and shipping emissions were excluded from the original 2050 target. But as the commission points out, they most definitely contribute to global warming and are covered by the temperature target of the Paris Agreement.
Other countries are moving in these areas and the International Civil Aviation and maritime organisations have net zero 2050 goals in place. Air New Zealand and the global shipping giant Maersk both support including these emissions in the 2050 target, which the commission finds to be achievable under multiple different pathways.
New Zealand’s dependence on shipping and air transport is a challenge. The commission puts the combined emissions from these sectors at 6.7 megatonnes – 20% of total CO₂ emissions and close to all industrial or all passenger car emissions. The aviation industry in particular is planning for growth, which, unless addressed, will blow the 1.5°C carbon budget both for New Zealand and globally.
Drawing on “net zero pathways” prepared by the international aviation and shipping industries, the commission finds that including these sources in New Zealand’s revised 2050 target would be achievable. The sectors would not necessarily have to enter the Emissions Trading Scheme, but the status quo (under which these sectors do not attract GST, fuel tax or a carbon charge) is inequitable with other sources of economic activity.
This article is republished from The Conversation under a Creative Commons license. Read the original article. The author acknowledges the assistance and contribution of Paul Callister.
Between 1892 and 2012, Statistics New Zealand published an annual yearbook. As noticed by Matt Lowrie, the 1992 Yearbook included this sidebar which departed from the usual dry style of the previous hundred years:
Plus ça change. Thirty-two years later, New Zealand still has one of the highest rates of car ownership in the world, Paris is eliminating most of its on-street parking, and Sydney has just opened another light rail line. I wonder what caused this outburst from the normally staid statistics agency. Did the new Chief Statistician, Len Cook, want to shake things up a bit?
What particularly caught my eye was this bit:
In New Zealand the average car currently manages a mileage of 100 kilometres per 10 litres. To reach the Government’s target of a 20 percent reduction in greenhouse gas emissions by the year 2000, this would have to be cut to 100 kilometres per 3.5 litres.
Even under the generous interpretation that the target here refers to new cars only, we’re still nowhere near 3.5 l/100km; the last few years hover around 6-7 l/100km. Pretty startling when you consider that the popular Honda Civic (a kind of large hatchback or small station wagon) was already delivering 5.3 l/100km in 1985, and that twenty years after the introduction of the hybrid Toyota Prius in 2001, only 2% of the light vehicle fleet was hybrid.
But enough about cars. What about that Government target of a 20% reduction in greenhouse gas emissions by the year 2000? Where did that come from? Needless to say, we’re not there yet either. Gross emissions of long-lived gases, and net emissions of all gases, are both up 40% on 1990 levels. This year, despite the downturn, 210,000 fossil-fueled cars will be imported, which if parked up would fill the entire length of State Highway 1. (Sorry, I mentioned cars again.)
To answer this I want to go back to a fascinating document from 1990, “Responding to Climate Change: A Discussion of Options for New Zealand”.
This was the year of the first IPCC report as well as of New Zealand’s first reports on climate science, climate impacts, and policy options. It was the year that both Labour and National (who defeated the incumbent Labour party in the October 1990 general election) adopted emissions targets. The May 1990 Climate Options report led to Labour adopting a target of –20% on 1990 levels by 2005. The election was to be held on 27 October; with a major international climate meeting falling on 29 October, National announced their own, more ambitious target (–20% on 1990 levels by 2000) just two days before the election.
The 1990 Climate Options Report
The report is comprehensive and offers 93 different options for consideration. They are grouped under social and behavioural measures, planning measures, market measures, legislative and regulatory measures, energy, transport, commercial buildings and households, industry, energy efficiency, agriculture, and forestry. Pretty comprehensive, and all of the options are given a balanced hearing. Any or all of them would have been a good idea.
Transport, as such a large source of emissions, is given a particularly thorough going-over. Suggestions include mandatory tune-ups, fuel efficiency standards, rebates for scrapping old vehicles, lower speed limits, fuel efficiency standards, fuel efficiency labelling, business tax incentives and levies, CO2-linked registration fees, integrated transport planning (hah!), mode shift such as rail freight, responsible town planning, staff transport, optimisation of freight routing and loading, and alternative fuels – CNG, biogas, bioethanol, electricity, and hydrogen.
One of the transport options in the 1990 report. 45 mpg is equivalent to 6.3 l/100km, a level that has still not been reached in 2024.
What’s notable is that all of these ideas were either already in use or under active consideration in many countries. The US introduced fuel efficiency standards in 1975. Norway introduced EV incentives in 1990, after the pop group A-ha had toured the country in an EV (refusing to pay tolls) the previous year. (Thirty-six years later, a quarter of the cars in Norway are electric, which gives some idea of the time and determination required for a technology transition. Per-capita transport emissions in Norway did not begin falling until 2010, and have only now returned to 1990 levels. On its present course, Norway will have decarbonised road transport by 2050, a sixty year journey.)
Morten Harket (left) and Magne Furuholmen from A-ha with Prof Rostvik (second left) and Frederic Hauge with their converted electric Fiat. (source)
So what happened? Unfortunately, from a promising start, the front fell off New Zealand’s climate response almost immediately. As Kirsty Hamilton writes,
This was particularly disappointing because most of the ingredients for a world class national response were present in New Zealand at the end of the 1980s. However, by 1997 New Zealand had gone from being in a prime position to serve as a positive catalyst in the debate, to at best sitting on the fence on key issues, and at worst becoming an impediment to the formulation of an effective international response to climate change.
Consideration of transport emissions virtually fell off the radar for years or decades. Consider the fate of just two of the policy options, fuel efficiency standards and labelling. (I lied when I said “enough about cars”.) They did not progress during the 1990s, but when Labour returned to power in 1999, standards and labelling did eventually make it into a policy document, the New Zealand Transport Strategy 2002. Labelling came into effect in April 2008, but standards fell victim to the election later that year that brought National back to power. Without standards, labelling did next to nothing. Another attempt by Labour to introduce standards in 2018 was blocked by New Zealand First; it took a further electoral cycle before standards were finally came into effect in 2023, 33 years after they were first suggested. That same year National returned and immediately weakened the standards.
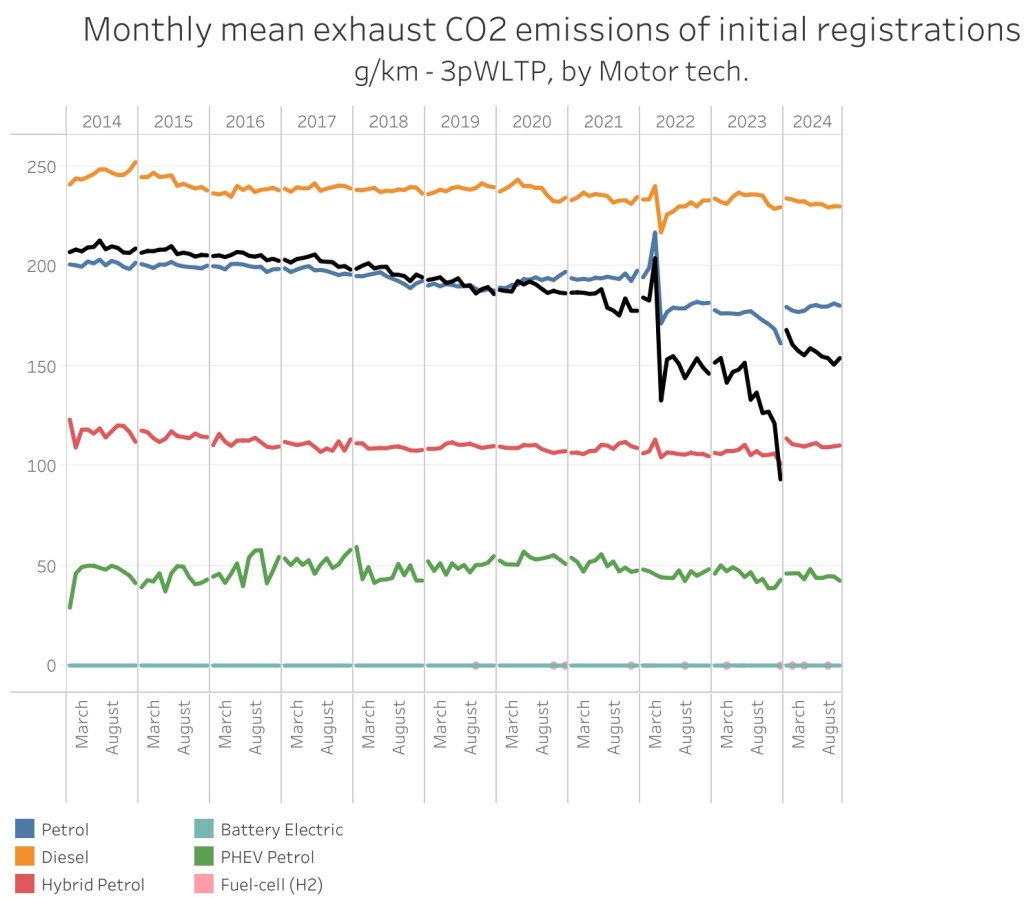
Emissions of newly registered light vehicles, 2014-2024, showing a reduction from 208 gCO2/km in 2014 (8.9 l/100km) to 156 gCO2/km in 2024 (6.7 l/100km). The Clean Car Discount (feebate) was in effect from July 2021 to December 2023. (Source)
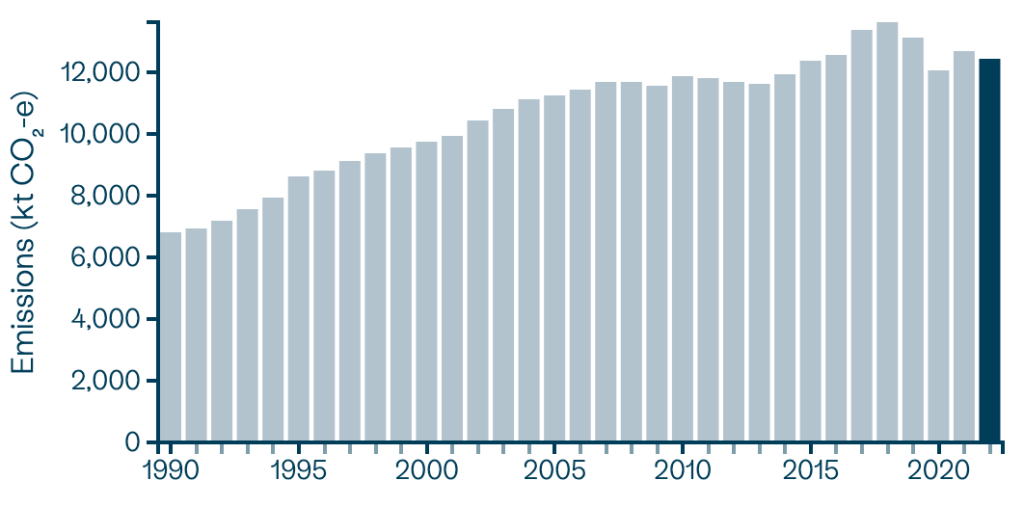
New Zealand’s road transport emissions increased 82% from 1990 to 2022. The increase per capita is 18% (source).
It’s been a similar story of vacillation in almost every other sector. Some of the causes run wide and deep and span the entire problem of climate change itself. Rather than go through the whole history, I want to stick to the 1990 report and ask – did they miss anything? I mean, clearly the authors did not anticipate the strong, organised and persistent opposition that would be raised to virtually any suggestion on how to cut emissions. Perhaps they can hardly be blamed for that. Did they miss anything that could plausibly have been included, and if so, would it have made any difference?
I think they did. They did miss the significant impacts of population growth (57% from 1990 to 2023, faster than the world average) and economic growth (also 57% in real per capita terms, faster than the US). Efficiency gains would have to be really heroic to overcome both of those. Questioning them would have killed the report in any event. Also, the authors weren’t thinking in terms of phasing out fossil fuels entirely, but that need wasn’t widely recognised until fairly recently, and remains a stumbling block even today.
No, the big thing they missed was renewable energy. I could hardly believe it. I had to read the report twice to be sure. In a 100,000-word report (the length of a decent novel), this is all we get:
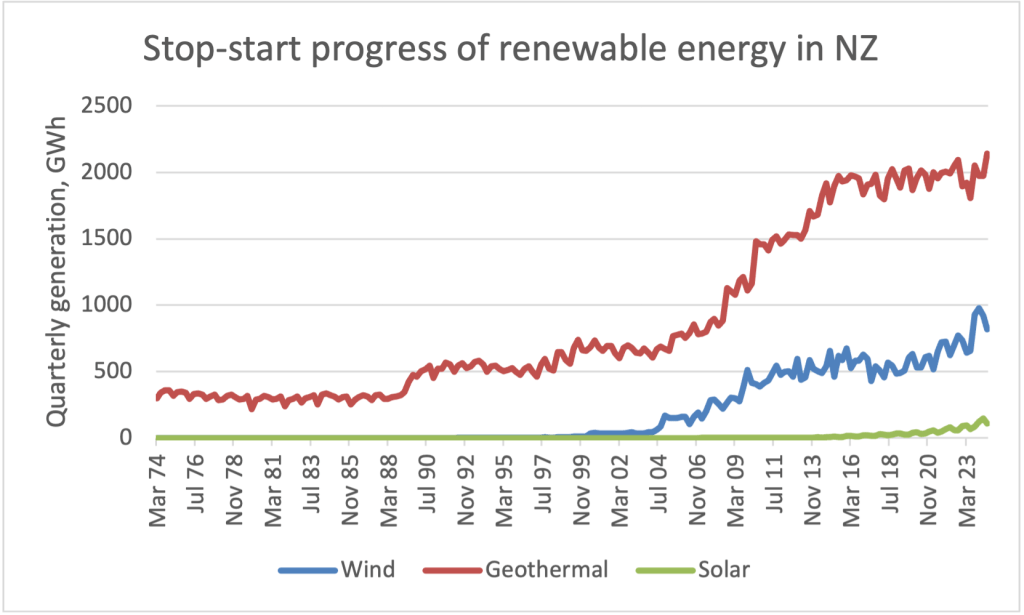
Surely the central importance of replacing fossil with renewable energy was well established by 1990? It’s even more surprising in view of New Zealand’s long-standing pride in its renewable resources (despite an unfortunate detour into gas in the 1970s). 1990 may have been a bit early for solar, but it was not too early for wind. Denmark was already generating 610 GWh a year from wind power in 1990 (similar to the Manapouri hydropower station), as was California, both having started in the 1970s. A New Zealand energy research group had published a report in 1987 outlining the feasibility of twelve 250 MW wind farms, triple what we have now in 2024. We built the first substantial geothermal power station in the world in 1958 and have never lost our world-leading expertise. Moreover, our second geothermal power station at Ohaaki (producing a sizeable 300 MWh a year) had only just opened the previous year.
I’m at a bit of a loss to explain this. Our experience in renewable energy since then has been one of repeated stops and starts, whereas the evidence from other countries is that large-scale transitions, whether in energy, transport, or otherwise, can take many decades and require sustained consistency of focus. Denmark has only largely decarbonised its electricity supply now, fifty years after their journey started.
Source: New Zealand Energy Quarterly, MBIE
I started out by calling this essay “What have we learned?”. Perhaps that was a bit ambitious. Is the lesson that comprehensive policy development and engagement is not enough? That we should have picked a smaller, more focused target and gone after it hard and fast, to bed in momentum and support? Or should we have been bolder to begin with? In the UK, the Royal Commission on Environmental Pollution (an independent agency in existence from 1970 to 2011) went really hard out in their 1994 report Transport and the Environment. They recommended doubling the price of petrol over the coming ten years, reducing total driving, and greatly curtailing road building. Even though none of that happened, their report is right on the facts, and perhaps it did set the scene for other measures which did eventually come about, and which have survived several changes of government.
Thirty-four years after our first climate report, we have at last turned the corner on emissions. In that sense we are on the way. But the harder step, of achieving a society-wide consensus on where we want to be and how to get there, still lies ahead.
Gillespie, A. (2001). New Zealand and the climate change debate: 1995–1998. In Climate Change in the South Pacific: Impacts and responses in Australia, New Zealand, and small island states (pp. 165-187). Dordrecht: Springer Netherlands.
Cherry, N. (1987). Wind energy resource survey of New Zealand: National resource assessment: summary and final report. New Zealand Energy Research and Development Committee, University of Auckland.
Under the Paris Agreement, countries periodically submit NDCs or ‘Nationally Determined Contributions’. The first one covers emissions from 2021 to 2030, and the second (covering emissions out to 2035) is due early next year.
The Ministry for the Environment is consulting on our second NDC (due 8 December 2024). The world is currently on track for up to 3 ºC of warming by 2100 and the UN has called for more ambitious near-term targets. As I wrote earlier, New Zealand is currently warming at 3 degrees per century; unless emissions reduce, we’ll blow through both 1.5 and 2 ºC in fairly short order.
Public submissions close on Tuesday 1 October on the Crown Minerals Amendment Bill which, amongst other things, will reverse the 2018 ban that limited new petroleum exploration permits outside onshore Taranaki.
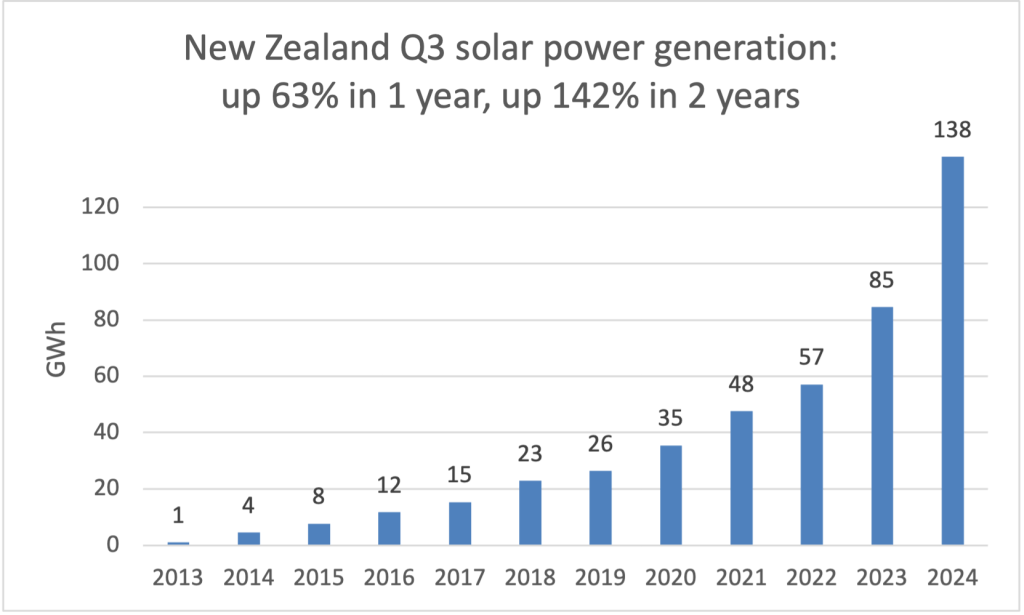
There’s a lot going on here, but one thing I would like to bring to the Government’s attention is this graph, showing how the New Zealand solar power industry has grown 46% annually for ten years in a row. It’s poised to continue, with an enormous pipeline of new projects under consideration.
But it could be stopped in its tracks by an anti-climate government. It’s happened before, with geothermal power and with wind power, both of which were stopped for a decade until the passage of the Zero Carbon Act which showed that the climate crisis was being taken seriously. It happened again with the cratering of electric car sales: anti-climate signals from the top do seem to have an effect.
For these solar projects and others like them to go ahead, developers need to know that demand for low-carbon electricity will be there. That demand comes from phasing out fossil fuel, particularly (in the context of this Bill) natural gas.
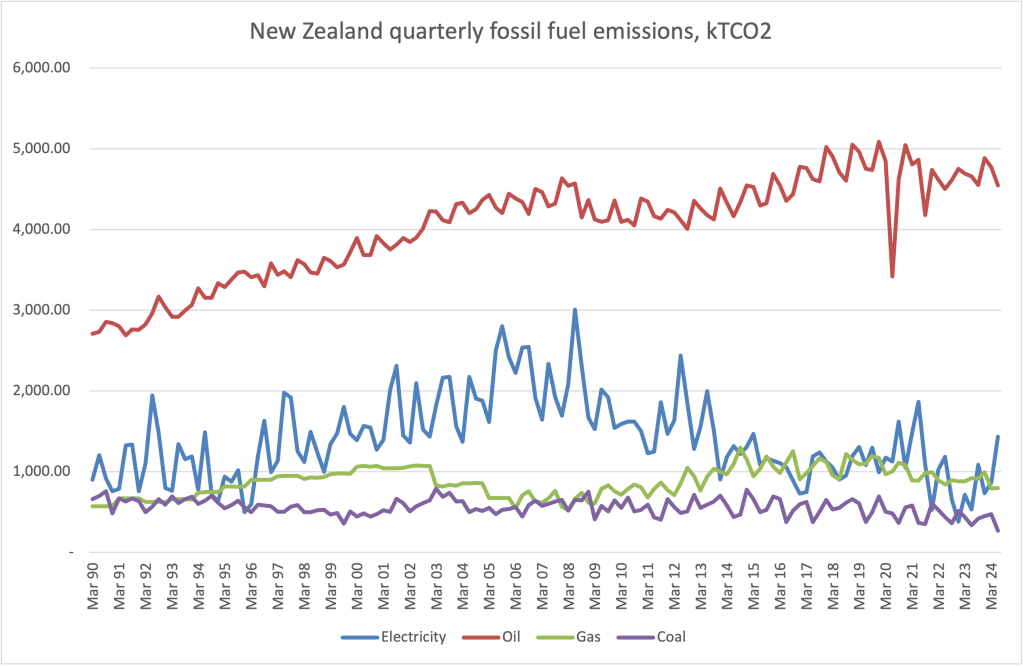
The Energy Quarterly from the Ministry of Business, Innovation and Employment reports fossil fuel emissions from electricity generation, oil, and (industrial, i.e. non-electricity) coal and gas. The June 2024 issue shows that oil, coal, and gas are all down from the previous quarter.
Electricity emissions increased, but even this is something of a good news story: despite inflows to the hydro lakes being at 90-year lows, new wind and geothermal plants completed in the last few years are avoiding 2 million tonnes of CO2 per year. As a result, we entered winter with lakes at average levels and they never fell anywhere near the warning line.
The lowest level of storage, around 1500 GWh, was not unusually low – similar or lower levels were reached in 4 of the previous 14 years.
Thus the investments triggered by the pro-climate Zero Carbon Act of 2019 meant that an electricity shortage was avoided. And annual electricity emissions, though off their lows, are still 59% below peak.
Oil accounts for two-thirds of emissions from the burning of fossil fuels. However, even oil consumption has been fairly flat for 11 quarters in a row, and remains 4% below record highs. High prices and behaviour change (and to a lesser extent EVs) are responsible. The cost of oil in real terms per capita has tripled since the 1990s.
Industrial coal use is at record lows, and now 41% below peak. Gas use is 23% below peak. Overall, annual emissions are 9% below their peak.