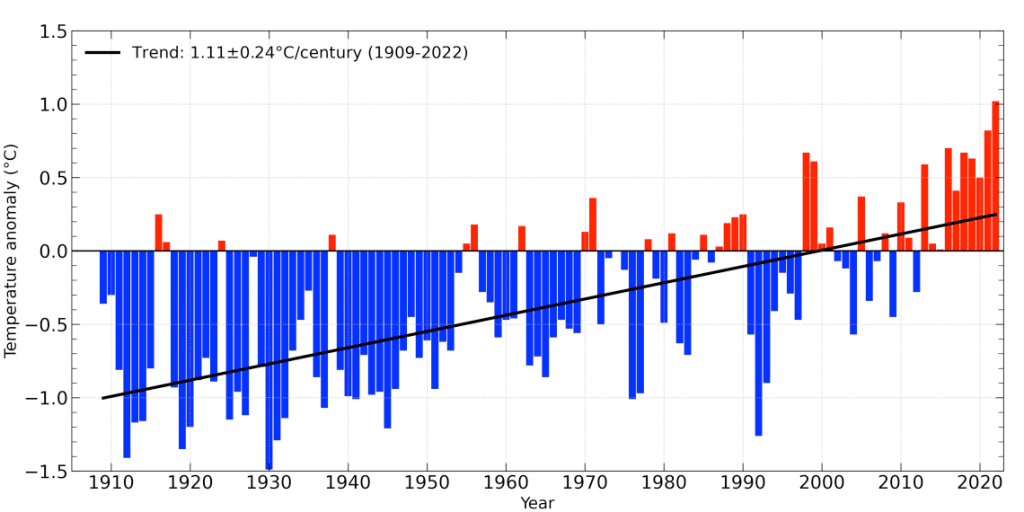
But is that straight line a sound model of the trend?
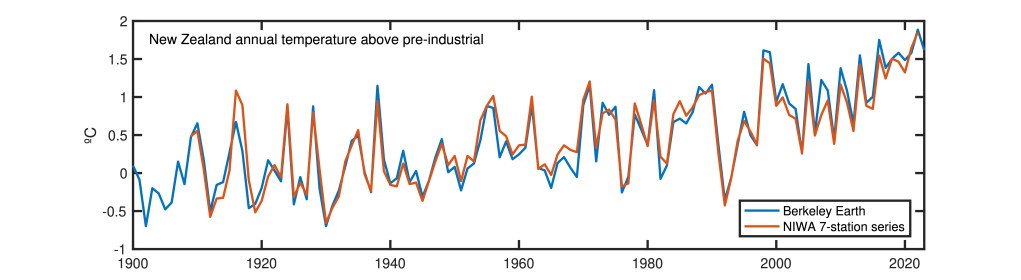
Recently, Berkeley Earth released preliminary data for all countries in the world. Although based on data from 86 sites, rather than 7, it gives very similar results to NIWA:
Some years stand out well above the trend. 1938 was particularly warm, at 1.15 ºC above pre-industrial, a record that would not be matched again until 1971. In April 1938,
So much sediment washed into the river that the Esk Valley was left covered in silt one to three metres deep when the floodwaters subsided. The water was more than two metres over the floor of the Eskdale Railway Station, and silt lay 1.6 metres deep. The silt was dug out of some houses but the old road running up the valley remains buried beneath the road since built over it. Once the silt had consolidated on farmland, new fences were installed; some posts were placed on top of the old buried posts.
Silt in Esk Valley in April 1938 (Northern Northern Advocate, 23 June 1938) and in 2023 (RNZ).
1992 was particularly cold, at –0.36 ºC, a return to pre-WWII temperatures caused by the eruption of Mt Pinatubo in the Philippines. The effect on New Zealand (1 ºC below the trend for those years) was twice the world average. Kane Hartillrecalled:
1992… Amazing year, a rigorously cold winter. I was studying geology at Canterbury, and spending plenty of time doing ski-mountaineering trips to Cook and the Canterbury ranges. It seemed most of the year was drab grey with bone chilling damp cold southerly quarter winds… On one visit to Mt Hutt in late August the snow wall on the side of the access road was just over double bus height, about 8 meters. The upper T-bar lift line was cut down deep into the snow pack, there were 4-5 meter walls of snow each side along much of the ascent. I snowboarded with ice axe in hand from the summit of Mt Rolleston down the Otira valley to beyond the footbridge >5km. Then in the summer we used to go snowboarding on the permanent ice field in the upper Otira valley… it became hollowed out with caves through the later 90’s and disappeared. Pity, the most accessible ice caves in NZ at the time, 30-45min walking track from the highway… they were stunning blue like the Iceland ones.
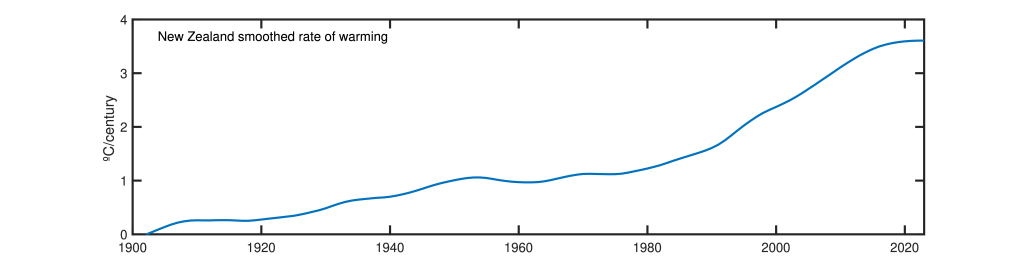
The smoothed temperature record provides an estimate of the rate of warming:
The warming appears to accelerate fairly steadily until about 1990, rising from zero to about 1 ºC/century. Then the rate of acceleration triples, with the warming rate increasing to over 3 ºC/century today. Because of the small land area and resulting variability, this estimate is pretty rough. But it is consistent with the global rate, which is also around 3 ºC/century. An acceleration to that kind of rate is expected under a medium-emissions scenario. On the other hand, warming stops when emissions stop.
Overall, New Zealand saw 0.89 ºC of warming in the 20th century, and another 0.73 ºC since 2000. The total, +1.6 ºC, is closer to the world average for land (+1.9 ºC) than for ocean (+0.9 ºC).
Submissions close on 25 August for comments on the Government’s second emissions reduction plan, which covers the period 2026-2030. You can also comment on changes to the first (2022-2025) plan, although that’s a bit of a joke because the proposed changes have already happened.
The Government now favours a “least-cost” approach, which I take to mean “least cost for a given level of risk and ambition”. But that very much depends on how you measure cost and risk. To me the plan looks high cost, high risk, and low ambition.
It’s proposed to delay decarbonisation of transport and energy by 15-20+ years – but tree planting would be at similar levels as advised by the Climate Change Commission. How does that add up?
The recent failure of a deal to deliver hydrogen-powered trucks to New Zealand, and the removal of a NZ$100 million government rebate scheme for green hydrogen users in the 2024 budget, make a transition to the much-lauded energy technology increasingly less certain.
The government had invested $6.5 million for the purchase of up to 25 heavy freight hydrogen trucks as part of a wider energy strategy due by the end of the year. But the US company Hyzon, which makes hydrogen fuel-cell trucks and had been modifying diesel trucks to use hydrogen, pulled out at short notice.
Nonetheless, interest in hydrogen for future transport and energy systems has soared globally, and New Zealand is no exception. But we argue that critical voices have been largely missing from the debate here.
In New Zealand, green hydrogen (which is produced with electricity from renewable sources) has attracted government support of $186.3 million from 2017 to 2023. This provided funding for a hydrogen refuelling network, vehicle conversions and purchases, research, and the establishment of the New Zealand Hydrogen Council (now Hydrogen New Zealand).
Proponents of green hydrogen argue it is essential for fuelling economic sectors they believe will be hard to decarbonise by direct electrification. As well as heavy road transport, this includes shipping and fertiliser production.
But opinions differ considerably on which sectors to focus on, and whether hydrogen is the best choice.
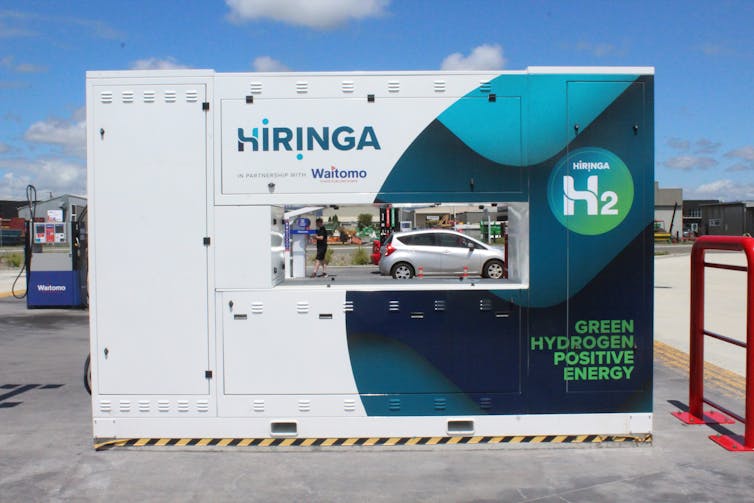
Government funding supported the development of a hydrogen refuelling network such as Hiringa Energy’s $7 million station in Palmerston North. Robert McLachlan, CC BY-SA
Evolution of the narrative
In the wake of the previous government’s ban on new offshore oil and gas exploration, the 2019 H2 Taranaki roadmap outlined a vision for the region as a leader in hydrogen production.
Former energy minister Megan Woods reinforced this, indicating her government would be interested in any associated economic opportunities. This largely positive narrative continued in two further government reports.
Hydrogen is poised to fulfil its potential as a clean alternative to hydrocarbons in the global pursuit of decarbonisation to address climate change.
Development of green hydrogen was largely implicit in the second report, the Interim Hydrogen Roadmap, which aimed to:
optimise the potential for green hydrogen to contribute to New Zealand’s emissions reductions, economic development, and energy sector to the extent compatible with our broader electrification goals.
We analysed these reports using a content analysis approach focused on identifying how often strengths, weaknesses, opportunities or threats are mentioned. This revealed the words “opportunities” and “challenges” were used frequently, while “weaknesses” and “threats” were absent.
The use of “strengths” was confined to perceived advantages of New Zealand as a location for hydrogen production. Where difficulties were identified, they were framed as challenges rather than weaknesses.
This optimistic tone is generally reflected in descriptions of several government-funded projects, including green hydrogen research at GNS Science, and international collaborations such as the German-NZ Green Hydrogen alliance.
Media reports have typically reflected the enthusiastic narrative. Of 83 articles on green hydrogen published in New Zealand between 2019 and 2023, only 15 (18%) contained any critical analysis.
Critical voices need to be heard
While some experts have voiced serious concerns about green hydrogen, this has not featured prominently in the debate in New Zealand.
For example, research by University of Cambridge engineering expert David Cebon shows battery electric vehicles are superior to hydrogen vehicles for heavy transport.
The emergence of fast (five minutes or less) automated and manual battery-swap systems, which provide an alternative to high-powered fast-charging systems, supports this point.
Since 2000, application after application of hydrogen has found it to be inefficient, ineffective and expensive compared to obvious alternatives.
A German rail company which launched the world’s first hydrogen line last year has since opted for cheaper all-electric trains. Rising costs have also forced one Austrian state to abandon plans to introduce hydrogen buses.
Recent research suggests developments in battery-run and fast-charging electric trucks could soon make hydrogen fuel cells superfluous in road transport in most cases.
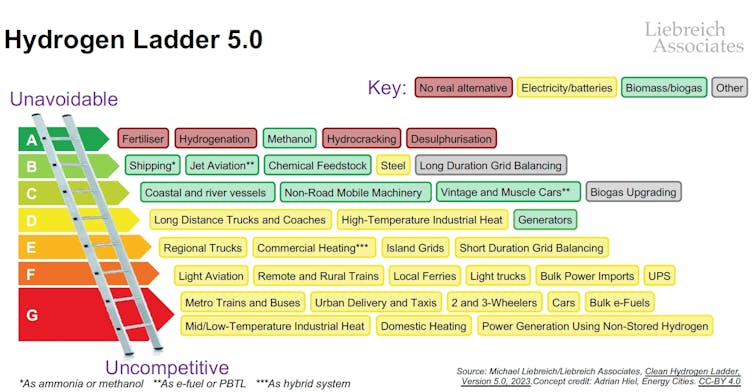
UK energy analyst Michael Liebreich has quantified the immense scale, significant impracticalities, enormous subsidies and costs associated with green hydrogen.
Liebreich’s “hydrogen ladder” ranks both actual and potential uses. It provides an evidence-informed guide on where to best focus attention and resources. Based on this, the previous government’s funding for the manufacture of green fertiliser (for which hydrogen is an input) was a sensible allocation.
The hydrogen ladder provides a guide on where to focus attention for the use of hydrogen. Michael Liebreich, CC BY-SA
The previous government’s commitment to finalise New Zealand’s hydrogen strategy, and to deliver an overall energy strategy, remains in place. But we need a more nuanced perspective.
This must start with an acknowledgement that hydrogen is an energy carrier (which has to be produced from other sources of energy), and not an energy resource like solar radiation, wind or hydro.
We need an approach that can continue to adapt to changes in “hard to abate” sectors of the energy system. Critiques of green hydrogen need to enter the discussion if we are to make informed choices.
Government policy on this topic must be informed by independent advice free from commercial interests. A new green hydrogen narrative will enable us to focus our limited resources on applications with the best chance of delivering on New Zealand’s decarbonisation and sustainability aspirations.
On 25 June, the Government amended the Clean Vehicles Act. This was completed in a single day under urgency, so there was no opportunity for public input. On 9 July, there was a press release saying that New Zealand would now be following Australian emission standards from 2025. On 11 July, the Ministry’s advice was released, giving us a few more details.
Vehicle emissions are reported in grams of CO2 per kilometre (gCO2/km). (For petrol vehicles, 200 gCO2/km is the same as 8.6 l/100km.) Here are the new targets:
Cars
Light commercials (vans & utes)
Previous target
New target
Previous NZ
New target
2023
145
218.3
2024
133.9
201.9
2025
112.6
112.6
155
223
2026
84.5
108
116.3
207
2027
63.3
103
87.2
175
2028
76
144
2029
65
131
The Minister talked to the Motor Industry Association (MIA), the Imported Motor Vehicle Industry Association (VIA), the Motor Trade Association (MTA) and the New Zealand Automobile Association (AA). We don’t have their reports, but, judging by what has been released, the Minister has accepted their reasoning at face value and rubber stamped their request. Neither Tesla nor Drive Electric (not members of the MIA) were consulted.
The Ministry report that their modelling of the emissions impact of this change has not been completed yet, but they do provide a rough estimate of an increase of emissions by 0.3–0.5 MtCO2 over 2024-2050. Another department, the Climate Impact of Policy Assessment, puts the increase at 1.2–1.9 MtCO2, but regards this as unreliable on the grounds that the previous targets were unlikely to be met – which is the car industry’s argument.
The car industry appears to take the position that they will do nothing whatsoever to respond to the targets, and just let the market take its course. Car importers would pay fines rather than try to meet the target. One key figure (which was also provided to Cabinet) is their estimate that this would add $5,500 to the price of every new light vehicle in 2027.
The fines are set at $45/gCO2, so the MIA are saying they’ll miss the targets by 122 gCO2 on average. The target for all light vehicles is 71 gCO2/km, so they’re saying they expect to sell vehicles averaging 193 gCO2/km in 2027, or nearly triple the target. That level (193 gCO2/km) is what we had already reached in 2021, before the introduction of the feebate and fuel efficiency standards. In 2022 the average was 167g; in 2023, 145g.
These industry and ministry figures look like nonsense, so let’s do a back-of-the-envelope calculation. Assuming no change in overall levels of sales, and that the targets are met, the annual extra emissions from vehicles sold in 2025 will be 46,000 tCO2; in 2026, 132,000 tCO2; in 2027, 120,000 tCO2. Over the 20 year life of the vehicles, the extra emissions from sales in these three years alone are 7.14 MtCO2.
That’s all assuming the targets are met. The industry says they won’t be. But one thing we did learn from the feebate experience is that both the industry and the car buying public are incredibly responsive to signals. Under the previous government, the signal was that it’s time to get serious about cutting emissions. The price signal (the rebate) was only part of that. EV sales vastly exceeded expectations, and the industry delivered. After the election, the signaling changed; the only electric ute on the market was withdrawn less than a week later.
Source: Ministry of Transport. The Clean Car Discount (feebate) was introduced progressively in July 2021 and April 2022, and cancelled in January 2024. Chart includes both new and newly imported used vehicles.
Second, missing the targets still achieves something. Fines are a deterrent and a signal to the industry. If they’re added to the price of higher-emitting vehicles, those sales will slow. Even for utes, that’s not the end of the world, it just means a slower replacement cycle until better vehicles are available. This will still prevent new, high-emission models entering the country and sticking around for decades.
There is one issue, though, which is that the fines, at $45/g, are low by international standards. They were set low because at that time, the intention was that the feebate would be doing most of the work and the Standards were mostly a backstop. In Australia, whose standards we are now adopting, the fines are $111/g, and in Europe, $170/g. (In Europe, where emissions in 2021 were already 40% below ours, not a single car company has had to pay fines for missing the targets.) Australia and Europe have extensive systems of incentives in place, which helps. New Zealand importers also have heaps of cheap credits available from overachieving in 2023 that (in another change) can now be used up until 2027.
When the Minister of Climate Change was asked about the impact on emissions, he said that “Clean car standards … have quite an insignificant impact in regards to overall emissions targets”. The relevant number to compare to here is not total emissions, but the required annual emissions cuts as we move into the late 2020s. Those are about 2 MtCO2 per year. In that context, the change due the weakening of fuel efficiency standards – 6% of so of the total effort required – is significant.
However, the Ministry has an answer there too:
In our view the proposed targets will not impact the ability for the first emissions budget (or subsequent ones) to be met. This is because transport emissions are covered by the ETS, therefore changing the Standard’s targets might change how or where emissions reductions occur from a gross perspective, but not from a net perspective.
This comes pretty close to the common argument that nothing the government or anyone else does has any impact on emissions; if I emit more, others will emit less so that the carbon budgets are met. But, they throw in an extra twist by bringing in the gross/net distinction: basically the argument is that more trees will be planted to cover the extra emissions. None of these arguments hold water, but even if we accept them at face value, actions that lead to higher emissions in one sector will definitely have an effect on those other sectors that will now have to make up the difference. For example, through a higher carbon price. However, it appears that this effect was not considered.
The new targets do get tighter over time, particularly in 2028 and 2029. If those are met, we could still be on track to end fossil-fueled vehicle sales by 2035, as in Europe. (The new UK government is reinstating a 2030 end date.) But there are two caveats. First, Australia has an election next year. The opposition could easily make emissions standards an issue, as they tried unsuccessfully to do in the last election (“Ute tax!”). A change of government could see the Australian standards weakened, as has happened here. Second, our own new standards will be reviewed again in 2026. On present performance, the MIA would only need a quiet word in the Minister’s ear to wind back the standards.
The purpose of a fuel efficiency standard is to radically change the make-up of the fleet as quickly as possible. There do have to be changes. But the whole tenor of the Ministry’s advice is that no one should have to change or pay any more, the overriding goal is that “vehicle affordability is maintained and the mix of vehicles imported meets the needs of New Zealanders.”
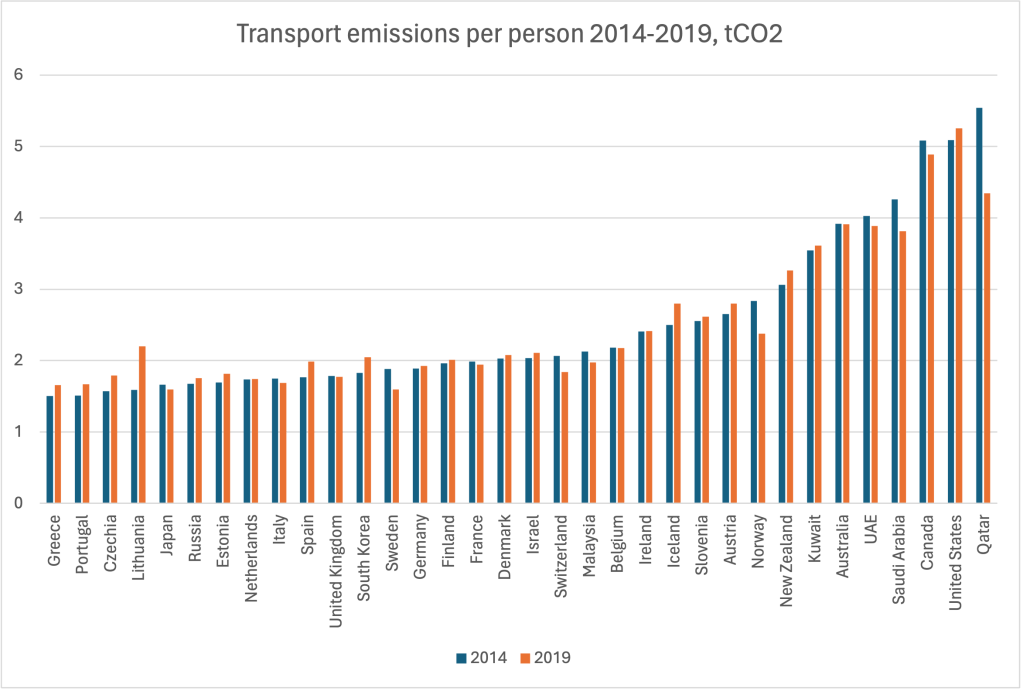
Reducing transport emissions is difficult, and it is something that many countries struggle with. But some countries are trying and are starting to see results.
Source: Our World in Data. Sweden has a target reaching of 0.6 tCO2/p in 2030.
Weakening fuel efficiency standards is the third of four parts of the Government’s “War on EVs“. Part 1 was ending the feebate; part 2 was the introduction of Road User Charges (RUC) for EVs, at a punishing rate. Iceland is the only other country in the world to try this, and there too sales have collapsed. Basically we are in uncharted waters. Part 3 is now done. Part 4 is still to happen: it’s the Government’s signaled intention to replace petrol tax with RUC for all vehicles. As petrol tax is currently equivalent to a carbon charge of $360/tCO2, this would amount to a hefty carbon tax cut and hence would also act to increase transport emissions. The extra cost of driving a hybrid (where sales are still holding up well) could be significant.
Fuel consumption l/100km
Current fuel/RUC cost cents/km
Fuel/RUC cost under an RUC-only system
0 (Battery electric)
12
12
4 (small hybrid)
10
14.5
6 (normal hybrid)
15
18
8 (normal car)
20
21.5
10 (large car)
25
25
12 (large ute)
30
28.5
Assumptions: Petrol $2.50/l, electricity 29c/kWh, RUC 7.6c/km
Fifty years ago, in the early 1970s, the environmental movement was in its first heyday. Pesticides, herbicides, and air and water pollution were on the front page every day. One of the key debates from that time was the question of what was the true underlying cause of the environmental crisis – what today we would call the global ecological crisis.
In one camp, Paul and Anne Ehrlich pointed to overpopulation and overconsumption. Their influence reached as far as Elmwood Normal School, Christchurch, where as a little boy I did a project called “People Pollution”. In the other camp, Barry Commoner completely rejected their arguments and blamed modern technology almost entirely. His argument was based around the extreme suddenness with which pollution had grown.
Fast forward fifty years and this question, is the root cause overconsumption or is it bad technology?, is still with us today. In reality it’s a bit of both (and they affect each other), but that’s not a very satisfactory answer.
I’m going to look at this in the context of New Zealand, and, in a twist, instead of looking at what our choices are in the near future, I’m going to look backwards over the past thirty years. What were our realistic options, and what did we choose? The past has one big advantage over the future: we know what technologies were actually available at the time and how they evolved. What if we had chosen different technologies starting in 1990?
Would it have been possible to have an economy broadly like ours, but with much less impact on the environment?
To make things simple I’ll just look at CO2 from fossil fuels. (It would be an interesting exercise to repeat this thought experiment for other environmental impacts.)
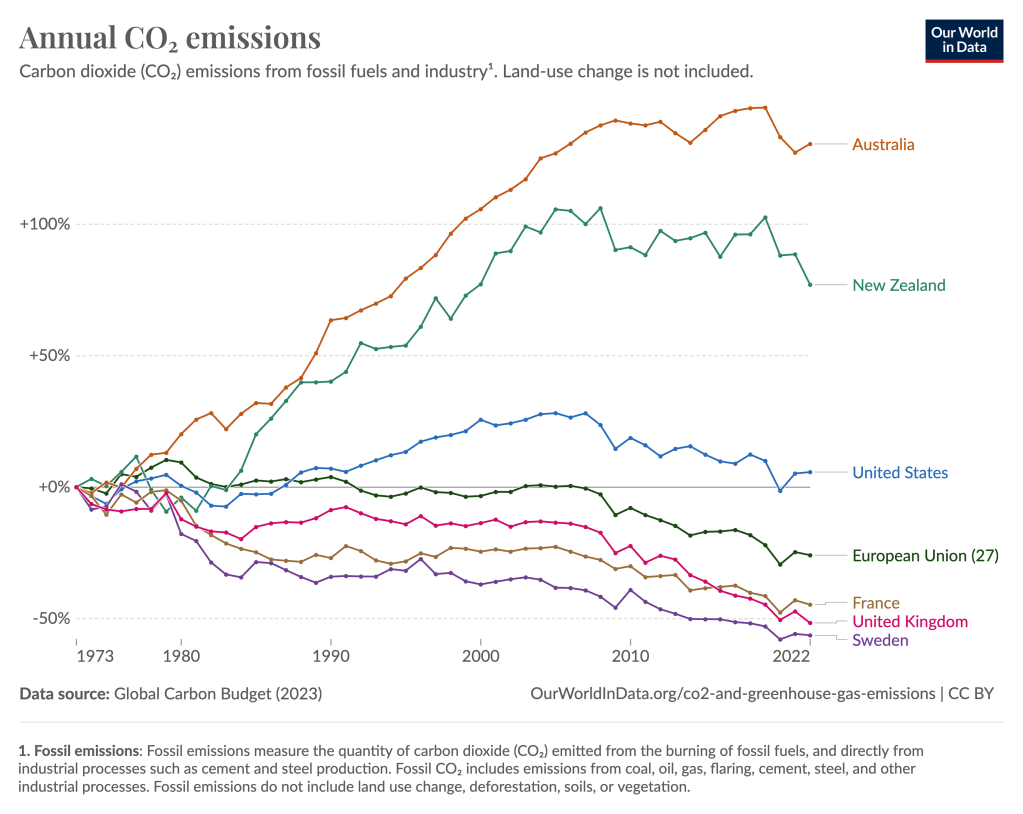
There is little suspense here because we know we have not been a great performer:
I’ve started this graph in 1973, the date of the first oil crisis. Higher prices put a lid on consumption for a while and spurred attention on efficiency. France turned towards nuclear power, Sweden towards biomass, first for district heating and then for liquid fuel. The UK started getting out of coal and into natural gas. In New Zealand, the Maui gas field had been discovered in 1969, at that time the eighth-largest gas field in the world, prompting extensive negotiations as to what to do with it. After a detour into self-sufficiency in liquid fuels (the world-first synthetic petrol plant at Motonui), ultimately the gas was used for new energy-intensive industries such as drying milk, and for electricity; much of it was exported in the form of methanol.
Since 1990 the New Zealand population and its economy have grown more rapidly than those of the EU or the US. The population of NZ has grown 60%, as has real GDP per capita. Both of those things tend to increase emissions, other things being equal. The economy is two-and-a-half times the size it was in 1990.
Meanwhile, fossil fuel burning has grown by 5.5 Mt or 25%. So, some relative decoupling, but still not great.
Let’s look at the main sectors.
Electricity
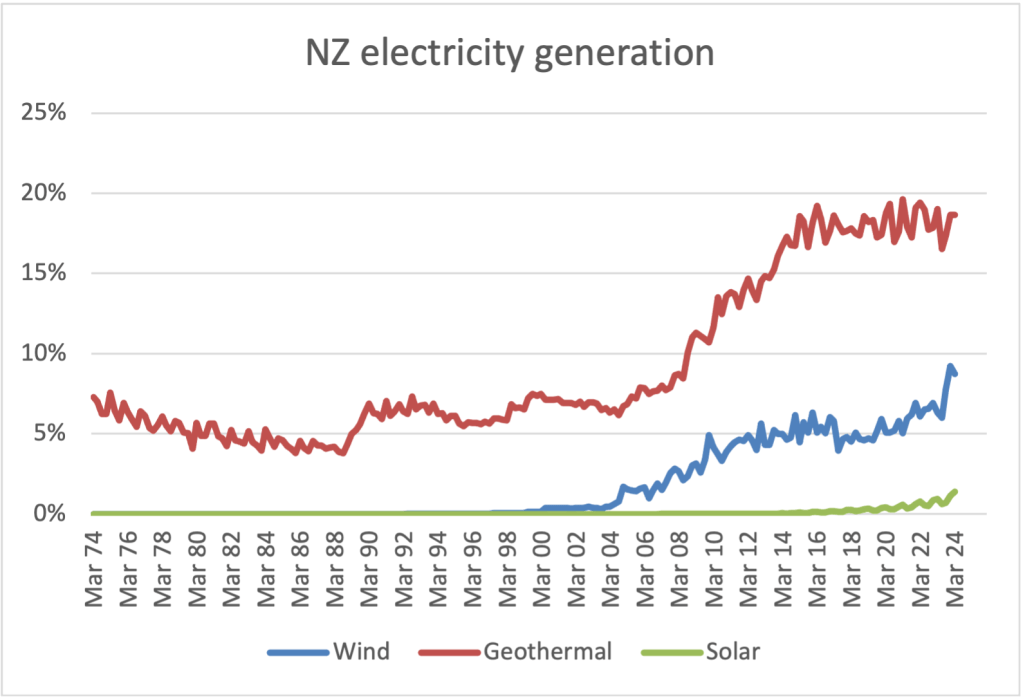
Electricity emissions rose from 4 MtCO2 to 10 Mt in 2005 (all that gas!) and then fell to 2-4 Mt. They could have been nearly zero by now. We could have built geothermal 20 years (even 50 years) earlier than we did. Wairakei (1958) was the first large-scale geothermal plant in the world; we were world leaders. (My first science job was a geothermal modelling project with the DSIR, in 1983.)
Then we could have built wind 10 years earlier, and kept at it instead of stopping and starting; and when Australia showed the way with solar we could have followed them, again 10 years earlier. Notice how both geothermal and wind show decade-long lulls in which entire nationwide industries stall due to insufficient focus on the environment. Just now, all three technologies are expanding again, but maintaining this long-term requires a determination to decarbonize the whole economy.
Industry
Industrial emissions have gone from 7 to 8 Mt, mainly due to the dairy industry. They had other choices, which they are only just getting around to installing now. (We did ‘save’ 1 Mt by closing the Marsden Point oil refinery, shifting the emissions to Singapore.) Likewise, instead of sending our scrap iron to Japan for 30 years, we could have recycled it here using electricity, as (thanks to the previous Government) we are finally getting around to. I’ll say we could be at 5 Mt now without much change to the economy.
Buildings
Emissions from buildings are up from 3 to 4 Mt – they could easily gone down if we had gone harder for energy efficiency and built up instead of out. What and where to build, and what to do with the existing stock of buildings, are still up for debate. These are contentious issues, so I’ll say the best we could have done is 3 Mt – but at least we would be well on the way to zeroing out this sector.
Transport
Oh yes, transport. This is the real culprit. Up from 8 Mt to 13.5 Mt, essentially the entire increase in our emissions. New Zealand had a car-dominated transport system in 1990. It still does today, only even more so. Could we have done better?
To be fair, transport is a difficult sector, one that all countries struggle with. But our choices have been worse than most. We could have imposed fuel efficiency standards in 1978, like the US, or in 2009, like the EU. (We did try in 2009, but the scheme was cancelled due to a change in Government – the cabinet paper makes for sad reading today.) Instead this was not introduced until 2023, and is about to be revised. We don’t even have a gas-guzzler tax like the US and Australia.
In New Zealand, transport emissions per person rose from 2.6 to 3.2 tonnes. In the UK, they fell from 2.0 to 1.8 tonnes. Since we had more scope for improvement in both efficiency and mode share, I’m going to say we could now be at 2.2 tonnes. We would still have a largely car-based transport system, just not quite so much. That would put our present total transport emissions at 9 Mt.
Adding it all up, CO2 emissions could have gone from 22 to 17 Mt using only technologies that were already in existence and proven in other countries. Even better, we would then be well on the way to ending the use of fossil fuels altogether.
I’m enjoying John Boshier’s “Power Surge: How Think Big and Rogernomics Transformed New Zealand”. For New Zealanders of a certain age, Think Big has cast a long shadow. I wonder if the generally negative popular view of Think Big played a role in opposition to the Lake Onslow project. Boshier gives a much more positive and nuanced view – Muldoon was faced with numerous crises to deal with simultaneously and oil imports were costing 15% of GDP (vs 2% now). In those circumstances, even the riskiest and least successful project, the synthetic petrol plant, made a kind of sense.
Incredibly, about a quarter of one year’s GDP was invested in eight Think Big projects over the six years from 1979 to 1984. That would be like spending $100 billion today.
Six of the eight are still operating successfully today. These are the ammonia-urea plant, the methanol plant, the third potline at Tiwai Point, the NZ Steel expansion, electrification of the North Island Main Trunk, and the Clyde dam. The eighth one, the Marsden Point oil refinery expansion, operating profitably for many years before closing in 2022 due to Chinese competition.
The final chapter, “Climate Changes Everything”, is fascinating, both for the relevance of Think Big to today’s decarbonisation challenge and for just how much has changed since the book was published in May 2022. Boshier’s examples of changes underway include:
– Tiwai Point closure (since reversed) – Marsden Point closure (confirmed) – possible complete electrification of the NIMT (looking less likely now the whole network is under threat) – gas pipelines to carry 20% hydrogen by 2030 and 100% by 2040 (very unlikely) – offshore oil and gas ban (reversed) – NZ Steel under threat (will now decarbonise thanks to government co-funding) – NZ Battery Project (cancelled) – iREX ferry project (cancelled) – 1500 hydrogen trucks ordered for 2026 (none here yet, and the supplier is nearly bankrupt)
Perhaps the biggest problem is to change people’s consumption patterns. The Climate Change Commission hopes that reductions in carbon emissions will be achieved by a societal shift in attitude as their costs begin to bite through the emissions trading scheme. Its approach is that no one will be forced to sell their petrol car or install solar electricity, for example. We can but hope this is the case and that deep intervention by government, as seen with Think Big, can be avoided.
Perhaps the key word here is “deep”, for there is certainly intervention happening all the time. There are great possibilities for bioenergy and electrification, but the risks are such that investors will want government support, like the support they can get already in other countries. At the same time, despite the Zero Carbon Act, we don’t yet have a commitment to phase out fossil fuels. Without that, the demand for the new renewable electricity the government wants to see may not materialise.
The final words of “Power Surge” are
There is every reason to look forward with confidence. We have done this before. Ka huri taku aro ki te pae Kahurangi, Kei reira te oranga moku. We turn our attention to the future, That’s where the opportunities lie.
RenewEconomy is a well-established Australian website focusing on green energy. Last week, they published an article by Andrew Blakers based around the claim that “New solar capacity is being installed faster than anything else in history.”
This received some push-back online (“disinformation!”), on the grounds that
(i) this is only electricity, not total energy; and
(ii) nature doesn’t care how fast something is installed, only about emissions.
We were directed to look at this graph from Our World in Data:
It’s true that solar forms a minute part (2%) of the energy supply as yet, and that emissions of no single fossil fuel has peaked, not even coal.
But the topic at hand is change, and for that we have to look a bit closer.
The low-emission transition is based on two main things:
(i) decarbonising electricity; and
(ii) switching all other energy uses to electricity (“electrify everything”).
You could add more items, such as using less energy in the first place, but that wouldn’t prevent the need for (i) and (ii).
Andrew Blakers is Emeritus Professor of Renewable Energy at the Australian National University, well-known for his work on 100% renewable energy futures and his contribution to the development of solar PV technology. I would be surprised if he had messed anything up.
On the surface the claim passes easily: 360 GW (gigawatts) of solar PV was installed in 2023 (the IEA says even more, 510 GW), and the fastest period of coal installation that I can find is 75 GW per year, in the mid 2000s.
But it’s more instructive to look at electricity generation, rather than just installed capacity. Solar has a particularly low capacity factor – it generates less when it’s cloudy, and not at all at night time. It’s also at risk of going unused when too much is generated at the same time.
To look at this I have carried out the following steps:
I downloaded data on world electricity generation from ember.org.
As generation fluctuates a lot from year to year, I smoothed the data to reveal the underlying trend.
I computed the change in generation from each year to the next.
Steps 1 and 2 give the following results for the 6 main sources of electricity:
Solar is the smallest of the six, and the fossil sources are still growing.
Step 3 gives the following results for the growth rate of each source of electricity:
Coal’s rate of growth peaked at 300 TWh (terawatt-hours) per year in 2005 (the rise of China); it then declined until 2019 before accelerating again. Some of that is offset by a slowdown in gas. But still, the combined slowdown of coal and gas stopped in 2020, which is alarming.
Solar added nearly 300 TWh in 2023, more than any other source, and pretty much matching coal’s old record. Actually, the 2023 data from Ember is provisional – if the IEA’s estimate is correct, the increase could be 400 TWh.
My conclusion is that the original headline (“solar is being installed faster than any technology history”) may be a bit breathless and lacking context, but the underlying trend is clear, and the record is significant. 2023 really was off the charts, and more is yet to come. Solar power generation is increasing as fast as any kind of electricity has ever done. This has been done despite many regions placing no restrictions on fossil fuels at all, and the global average carbon price being just US$5/tonne.
[This is my personal submission to the Draft Government Policy Statement on land transport. Submissions close at noon on Tuesday 2 April, 2024.]
In the Emissions Reduction Plan (ERP1), transport emissions fall 41% by 2035. As the Ministry of Transport says, “Achieving this will reduce our dependence on fossil fuels and give us a more sustainable, inclusive, safe and accessible transport system that better supports economic activity and community life.” There is plenty of detail in the plan:
The plan is supported by four specific transport targets:
Target 1 – Reduce total kilometres travelled by the light fleet by 20 per cent by 2035 through improved urban form and providing better travel options, particularly in our largest cities.
Target 2 – Increase zero-emissions vehicles to 30 per cent of the light fleet by 2035.
Target 3 – Reduce emissions from freight transport by 35 per cent by 2035.
Target 4 – Reduce the emissions intensity of transport fuel by 10 per cent by 2035.
Targets 1 and 3 are wrecked by the Draft GPS, while Target 4 is already suspended. Target 2 is also threatened by related government actions to slow the uptake of EVs and other low-emission vehicles: cancelling the CCD, imposing high RUCs on EVs (a world first), proposing to weaken the CCS, and proposing to replace fuel tax by RUCs based on distance and weight.[1] The Ministry advise that the first two of these alone may limit EV share of the light vehicle fleet to 7% by 2030 (and 23% market share)[2], vs. 12.5% in the Climate Change Commission’s Demonstration Path (and 64% market share), putting the 2035 target at risk. However, the Ministry’s model involves 22,000 EV sales in 2024. In fact there were only about 1,700 sales in the first quarter.
The ERP1 for transport is not rocket science and should not be at all controversial. Internationally, all transport climate plans include the basic elements of fuel standards, mode shift, public transport planning. The IPCC in their summary of evidence say the same thing. The debate is over the mixture of fees, incentives, regulations, and bans, not over the direction of travel. The Draft GPS would wreck this plan. Spending on walking, cycling, and public transport would reduce and become highly constrained. Spending on rail infrastructure would reduce drastically, which could render the national rail network non-viable. That in turn wrecks the New Zealand Rail Plan, intended to increase the proportion of heavy freight carried by rail by building high-tech truck/rail freight hubs and new rail ferries.
Dropping climate from the GPS drops it from NZTA, currently the lead agency charged with delivering emissions reductions from transport. What could replace it? The government is committed to meeting the emissions budgets, but have not yet released much detail about how they plan to do that, other than that the ETS will be the main tool.
But it is well known that carbon charges are not an effective way to reduce transport emissions. At current prices the ETS adds 15 cents per litre to the price of petrol, or $15/1000 km. The RUC rate for light vehicles is $76/1000 km. The carbon price would have to increase by a factor of five just to match that, which is unthinkable – it would destroy all other exposed sectors.
This issue has been covered extremely thoroughly in the international literature. In 2022, I co-authored a review with David Hall on “Why emissions pricing can’t do it alone”[3]. The Climate Change Commission identified ten types of barriers to a low-emission transition; tellingly, transport is the only sector for which they proposed specific fixes for all ten barriers. Nearly all of them are under attack.
So it is really flying in the face of evidence think that the ETS can be our main climate tool, particularly for transport. Details are lacking – Minister of Climate Change Simon Watts will only say that work on the second Emissions Reduction Plan (2026-2030) is under way. Analyst Christina Hood has repeatedly detailed how the ETS will struggle to deliver even under present conditions[4].
Emissions reductions first entered the GPS in 2015, under John Key. It was raised to a strategic priority in 2018 and 2021, but now it is proposed to be dropped. Presumably, all work streams in NZTA related to emissions reduction will be stopped and all work teams dissolved. So, despite all the other alarming and potentially disastrous parts of the Draft GPS, this one is the worst.
Section 5ZI(3) of the Climate Change Response Act 2002 states that
The Minister may, at any time, amend the plan and supporting policies and strategies to maintain their currency, (a) using the same process as required for preparing the plan; or (b)in the case of a minor or technical change, without repeating the process used for preparing the plan.
But the Draft GPS states, in contrast, that
Following the general election and a change of government in late 2023, the intended emissions reduction policies foreshadowed by the previous Government are being reassessed. For this reason, GPS 2024 has not undertaken the alignment exercise as anticipated in ERP1. The Emissions Trading Scheme (ETS) is the Government’s key tool to reduce emissions. In addition to the ETS, matters relating to climate change/emissions reduction issues are being worked through and will be addressed during development of the second Emissions Reduction Plan (ERP2).
Thus both the Draft GPS and the decision to not perform the alignment exercise are in violation of the Climate Change Response Act 2002. Note that the relevant “plan” referred to in section 5ZI(3) in this case is ERP1, not ERP2. In addition, many of the activities needed to support the 2nd and 3rd carbon budgets need to be undertaken in the first budget period.
Slower transport emissions reductions from existing policies mean that other policies will need to be developed to replace them. I am skeptical that the two that have been announced – higher carbon prices and faster EV charger rollout – can make up the difference. But at the very least the modelling and policy advice to support this approach should be published. To put it another way, the climate plan and the transport plan should be prepared together. But they have not been prepared together in what appears to be a deliberate strategy.
Another possibility is transport emissions will be allowed to decrease more slowly that previously intended and that other sectors will make up the difference. But transport is so large a share of emissions that it is hard to know where the other savings could come from. Three other large sectors are agriculture, industry, and trees. The first two may struggle to deliver greater cuts, while trees are already performing a far greater share of net emissions reductions than in any other developed country and are also facing policy challenges and risk transferring climate obligations to future budget periods.
To sum up, the Draft GPS constitutes climate denial.
Recommendations
R1. Perform the alignment exercise required of the GPS by ERP1.
R2. As the proposed changes to ERP1 are neither minor nor technical in nature, but strike directly at its heart, revise ERP1 using the process required by the Climate Change Response Act.
R3. Publish the legal advice received regarding R1 and R2 above.
R4. Reinstate emissions reduction as a strategic priority of the GPS.
the forces for increasing fossil fuel burning were vastly more powerful than the puny forces opposing them. All the talk about climate change in 2017–2019 had little effect on the behaviour of companies or individuals.
Have we turned the corner? Possibly. The pro-fossil fuel forces are still there, but the opposing forces are gathering strength, especially through the Zero Carbon Act which for the first time includes a falling cap on emissions. In the most sensitive sector, electricity, the changes can be seen already. My takeaway from the new 2019 data is that the big four, road transport, aviation, electricity, and food processing, that are so large, that have performed so poorly, and that have so much scope for transformation, are where we need to look for change.
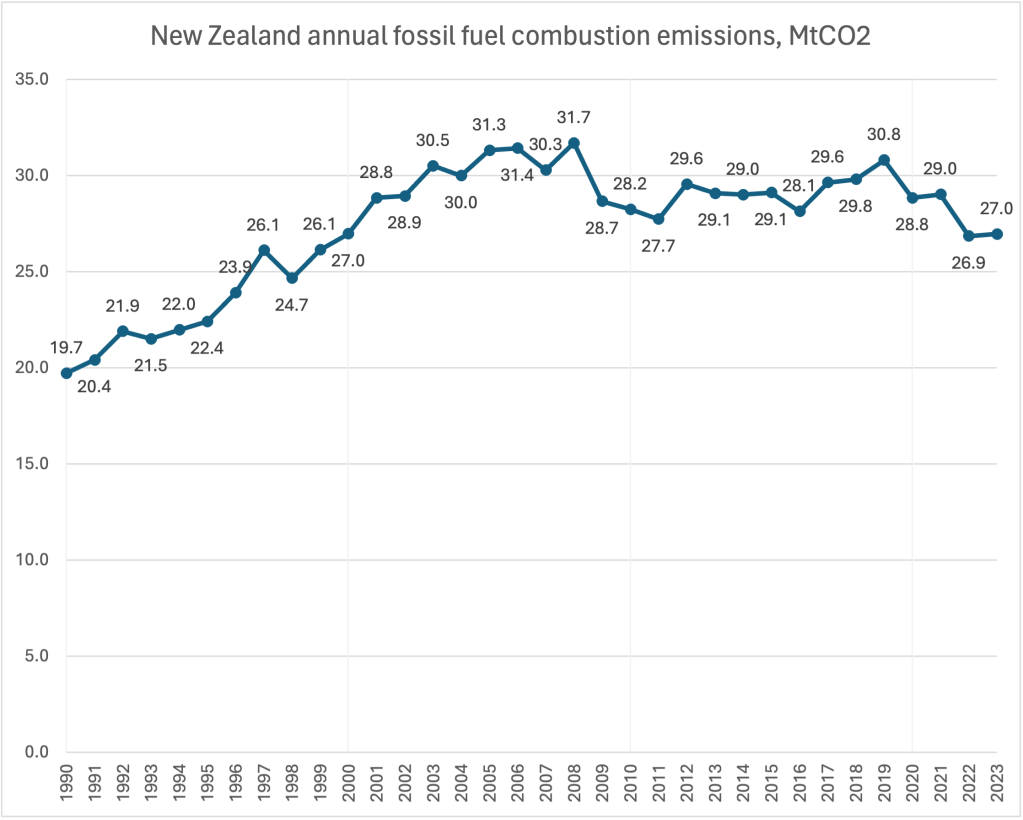
We don’t have full emissions data yet for 2023, but MBIE have just released a partial snapshot covering emissions from the burning of fossil fuels, which contribute 85% of gross CO2 emissions. 2023 was the first full post-lockdown year – travel restrictions were only eased in early and mid-2022.
Although emissions are up slightly, they are still well below the blow-out year of 2019, and stand at 23-year lows. 2022 and 2023 comprise the first half of the first 2022-2025 carbon budget, so low emissions in these two years will definitely help us meet the budget.
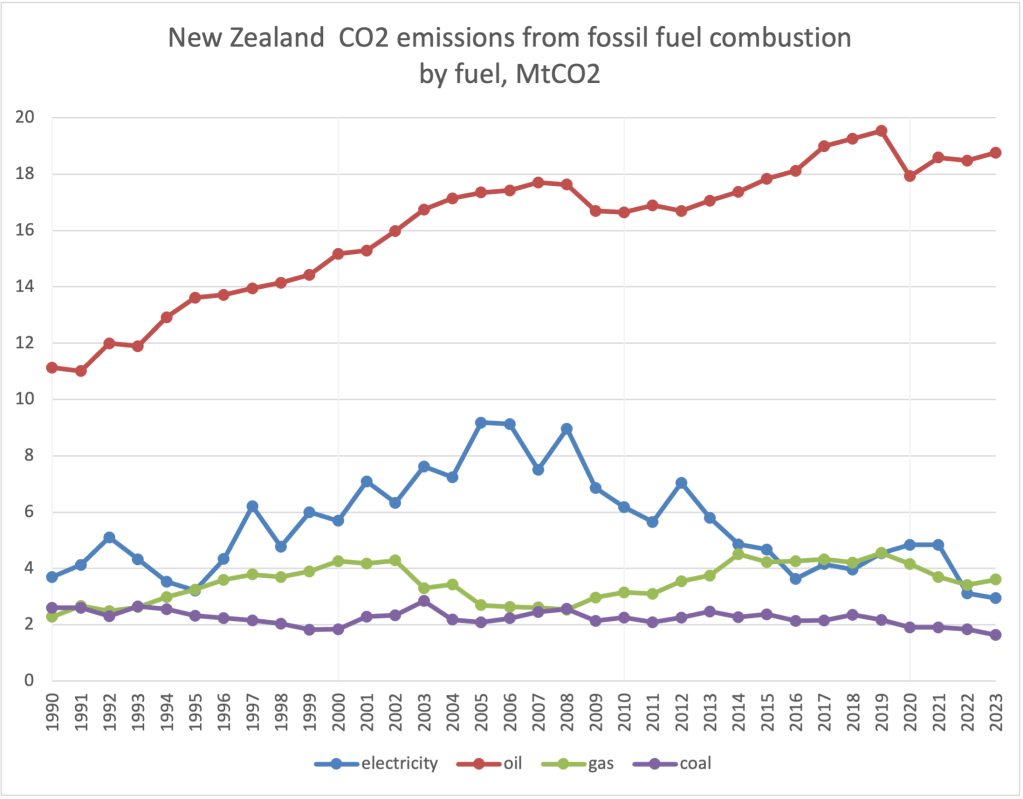
But digging into things in more detail, progress is not so great. Here’s the breakdown by fuel.
This shows that the fall in emissions in 2022-23 was due to falling electricity emissions, caused by full hydro lakes (hydro generation up 4200 GWh on the previous two years, or 5% of total generation) and new wind farms (up 1100 GWh). Solar (up 290 GWh) also started to make an appearance. That doesn’t mean that electricity emissions will bounce back, though: another 2800 GWh of new renewable generation is planned for the next three years, so even in an ‘average’ rain year we should be alright.
Clearly a major culprit is oil. It’s a big chunk of these emissions (70%) and it’s hard to move. Oil consumption is down on record highs, but not by much – closing the Marsden Point oil refinery in mid-2022 shifted 0.8 MtCO2 of emissions offshore, accounting for the whole decline.
The Clean Car Discount was introduced in mid-2021, and staying in place for 2 1/2 years, but has now ended. Road User Charges will be introduced on EVs in two weeks’ time, at a proposed rate of $76/1000 km – New Zealand will be the first country in the world to do this. (In Australia, the state of Victoria did impose RUCs on EVs, at A$25/1000 km, but this was annulled by the High Court last year.) There are also threats to weaken future fuel efficiency standards and to remove fuel excise duty entirely. Together these amount to a war on EVs which may lead to significant upward pressure on emissions. The fact that all the EVs in New Zealand are only saving 0.14 MtCO2 a year at present – too small to even see on the above graph – doesn’t mean they’re a failure, it just shows the scale of the problem and the persistence that is required.
Of course EVs are not the only or even the most important solution to transport emissions. In 2021 I wrote that “big battles over mode shift lie ahead” and these have now come to pass with the release of the Government’s draft policy statement on transport, which drastically de-emphasises cycling, passenger rail, and public transport. Climate Liberation Aotearoa have a handy mantra:
The first three are part of the first Emissions Reduction Plan, but the Government appears to think it is free to ignore the plan. As I read it, they are in violation of the Zero Carbon Act, which says that
The Minister may, at any time, amend the plan and supporting policies and strategies to maintain their currency (a) using the same process as required for preparing the plan; or (b) in the case of a minor or technical change, without repeating the process used for preparing the plan.
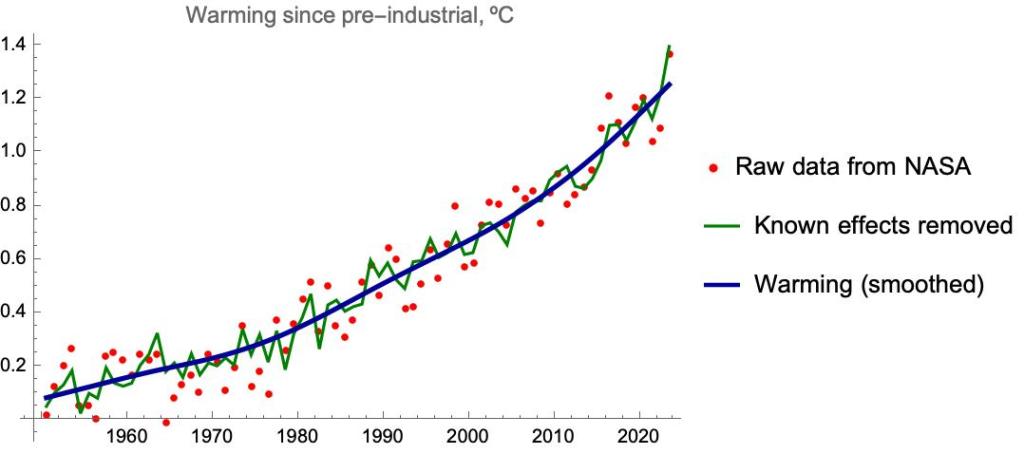
Here are the annual average temperatures relative to pre-industrial times, as measured by NASA.
2023 clocked in at +1.40 ºC.
There’s quite a lot of variation from year to year. Some of this is fairly well understood. Large volcanoes like Pinatubo (1992) cool the air for a year or two; The El Nino/La Nina oscillation alternately and irregularly warms and cools the air, as heat is transferred in and out of the ocean; and the 11-year solar cycle also contributes. Together these account for about half of the fluctuations – they are typically around ±0.08 ºC but can be up to ±0.2 ºC.
Recently, a well-known statistician updated an earlier study in which these known effects are subtracted out to reveal the underlying global warming signal:
He ends his analysis with the understated comment that “it appears that the rate of global warming has increased”.
What does the global warming signal look like if we remove the rest of the fluctuations? Here’s what I get:
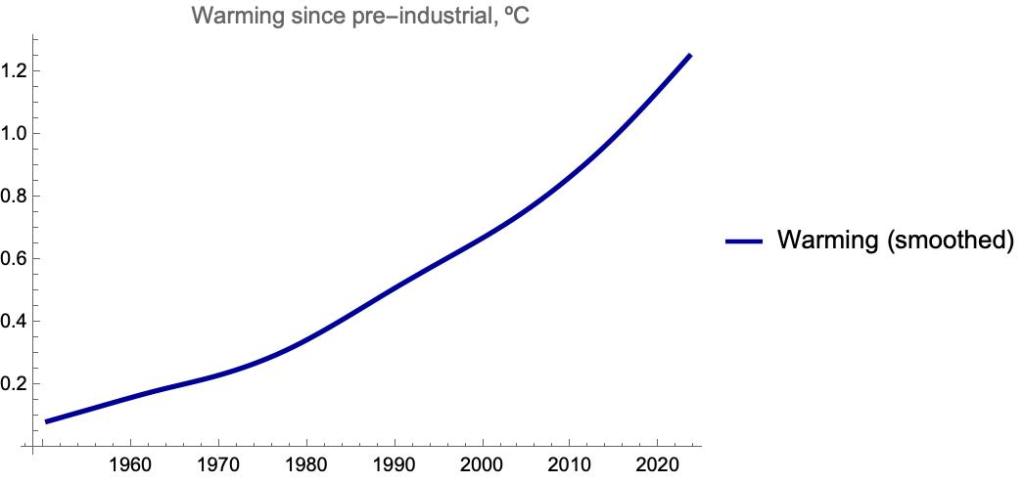
And with the smoothed signal only:
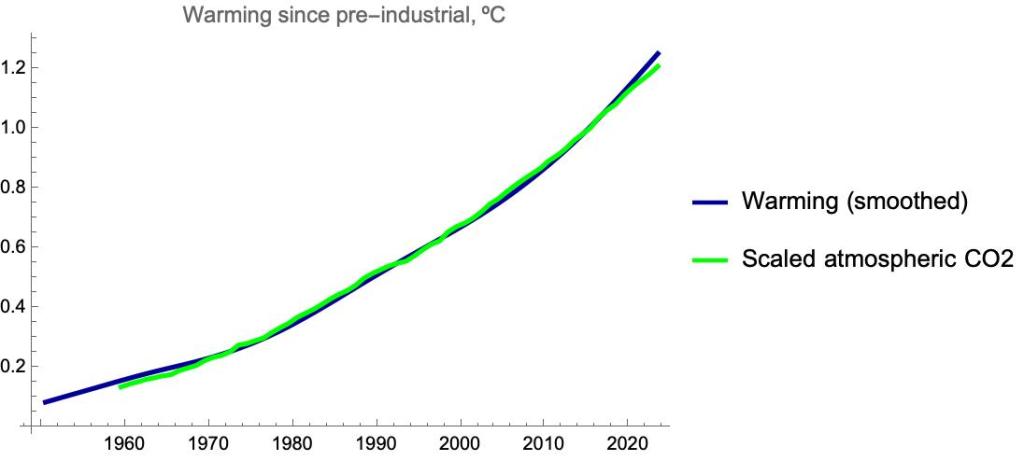
The underlying rate of warming is about 0.08 ºC per decade in the 1950s and 60s. It rises to 0.15 ºC per decade in the 1980s and 90s. In the past decade it has averaged +0.30 ºC per decade. The underlying trend value for 2023 is +1.25 ºC, meaning that if there is no further change in the trend, 1.5 ºC will be breached in 8 years.
There are a lot of contributors to the warming, but atmospheric CO2 is the main one. Here is the underlying warming trend shown together with the (scaled) level of atmospheric CO2: